 Corbanu
Chinese Memory: a Sovereign AI Long Thesis on CXMT
The Trade
Corbanu entered the CXMT (CXMT; Shanghai 688825) perpetual long through Hyperliquid at a venue-native mid of $8.3403 at 20:09:40 UTC on 4 September 2026, sized at 3.5% of capital in the tracker portfolio ahead of the company's first public results briefing on 7 September. We expect investor excitement around the memory build-out and the first management commentary on HBM3E to build into that meeting. That same afternoon Huawei launches the Mate XT2, Xiaomi puts CXMT (CXMT)'s LPDDR6 on stage in the 18 Fold that evening, and the reported Trump–Xi summit on 24 September will, in our view, center on national collaboration and competition in AI, with Xi arriving on the back of a domestic memory champion. The 3 September daily model forecast an 81.1% annualized funding receipt for the long over the next seven days, equivalent to 1.56% of notional over the forecast week. Our carry signal is that forward model output, not any single intraday observation. We have the exposure into the briefing and will reassess immediately afterward.
Fundamental exit. We will close the position after the 7 September briefing unless management explicitly confirms that at least 10% of current or planned DRAM wafer input is allocated to HBM and provides a commercialization or qualification timeline. An allocation below 10%, vague roadmap language, silence, or denial will trigger the exit. Price stops will have no role.
Valuation. At the ¥54.80 Shanghai close on 4 September, CXMT (CXMT) trades at 13.6x T+12m earnings and approximately 7.3x T+12m EV/sales, versus 4–6x and 1.6–4.3x for SK hynix (SKHX), Micron (MU) and Samsung (SMSN) (Table 4 retains the complete 2 September snapshot). Consensus revenue growth slows from 485% in FY26 to 63% in FY27 after 1H26 printed +874%, while Micron (MU) and the incumbents move customers onto five-year contracts. That deceleration leaves room for HBM3E estimate revisions. From the ¥54.80 close, a fast catalyst move to Mizuho's ¥70 or Capital Securities' ¥78 target would represent 28–42% upside. UBS sits at ¥80, Morgan Stanley at ¥88, Mirae Asset at ¥90, Nomura at ¥116 and Goldman Sachs at ¥129. These targets were published between 24 August and 1 September 2026.
If you put the wider market beside these numbers, you get a second valuation anchor: tech trades at 21x T+12m earnings on the Nasdaq-100 (XYZ100) and 50x on CXMT (CXMT)'s STAR 50 board, while the incumbents carry T+12m FCF yields of 12–27% on enterprise value. CXMT (CXMT)'s parent-attributable T+12m FCF yield is 6.6%, against 4.1% for the Nasdaq-100 (XYZ100) and 2.8% for Hang Seng TECH (Table 4). Funding and incremental high-value memory sales provide the catalyst for returns.
Probability-weighted return
After the 7 September briefing, the failed cases close. We keep the position through Huawei Connect, Alibaba (BABA) Apsara and the 24 September summit once there is confirmation of at least 10% HBM wafer allocation and a commercialization timeline. The combined 65% confirmation probability reflects the 31 August report, which said that CXMT (CXMT) had begun small-scale HBM3E production, supplied samples to Alibaba (BABA)'s T-Head and Cambricon, and targeted commercial use in 2027. Between the 27 July public forecast and 2 September, FY28 consensus remained essentially unchanged: revenue moved from ¥773.3bn to ¥762.2bn and parent net income from ¥393.1bn to ¥393.3bn.
| Outcome | Probability | Disclosure and action | Price anchor | CXMT price return | Portfolio contribution at 3.5% |
|---|---|---|---|---|---|
| Strong confirmation | 25% | At least 10% HBM allocation, timeline and named customer or qualification; hold through 24 Sep | ¥78 Capital Securities | +42.3% | +1.48% |
| Minimum confirmation | 40% | At least 10% allocation and timeline; hold through 24 Sep | ¥70 Mizuho | +27.7% | +0.97% |
| Vague or below threshold | 25% | Allocation below 10% or absent; exit after 7 Sep | ¥48.70 BNP Paribas | (11.1%) | (0.39%) |
| Denial or failed qualification | 10% | Management denies HBM readiness or pushes commercialization out; exit after 7 Sep | ¥23 Morningstar | (58.0%) | (2.03%) |
| Probability-weighted | 100% | ¥61.98 | +13.1% | +0.46% | |
| Probabilities are Corbanu estimates. Price anchors use analyst targets published from 24 August through 1 September 2026. The table reports price returns separately because the hold cases run through 24 September, beyond the model's validated seven-day horizon; the 3 September forecast is a 1.56% funding receipt over that first week and is not extrapolated beyond it here. It uses the Shanghai cash close as the price reference; actual perp returns will also reflect CNY/USD, funding and basis. Goldman Sachs's ¥129 target remains upside beyond the strong case. The table isolates the CXMT (CXMT) leg; the 1.75% CBRS short retains its separate catalyst model, and fees remain outside these returns. | |||||
Company Backdrop
CXMT Corp—ChangXin Memory Technologies (CXMT; Shanghai 688825)—is China's only scaled DRAM manufacturer and the world's fourth-largest DRAM maker. Founded in Hefei in 2016, it ships DDR4, DDR5 and LPDDR4X/5X wafers and modules into servers, phones, PCs and cars. Its own prospectus puts its share of the global DRAM market at roughly 7.7%, behind Samsung (SMSN), SK hynix (SKHX) and Micron (MU).
CXMT (CXMT) listed on 27 July 2026 at an offer price of CNY 8.66 and raised CNY 57.9 billion (about $8.6 billion), making it the largest Asian IPO of the year. It closed its first session at CNY 49.00, a 466% pop that made it the most valuable company listed in China on day one. The move has held: after reaching CNY 61.80 on 17 August, it closed at CNY 54.80 on 4 September, with a market capitalization of roughly CNY 3.72 trillion and 4.503 billion unrestricted shares available to trade, or 6.63% of shares outstanding, after the greenshoe.
Outside mainland China, the perpetual on Hyperliquid's TradeXYZ market is the cleanest access. Its ticker is CXMT. The Corbanu CXMT page has the live price, peers and fundamentals.
Simplified Financial Model
The reported figures come from CXMT (CXMT)'s Shanghai Stock Exchange filings: the FY2025 annual report and the unaudited 2026 interim report. Sell-side projections use consensus as of 2 September 2026. Appendix A contains the five complete financial and peer-comparison tables.
The business moved into profit in FY25. In 1H26, gross margin rose from 13% to 85% over twelve months, driven by price and mix. Consensus carries that run-rate forward: FY26E implies 211bn of second-half revenue, up 40% sequentially, at a 51% net margin. FY27–28 then add volume at roughly flat margins.
Consensus's +133% EPS growth from trailing to FY26E breaks down into +84% from revenue, rising from 196.7bn to 361.4bn, and +27% from net margin, rising from 41.6% to 52.7%. The 52.7% forecast carries the 1H26 margin of 51.6% across the full year. Beyond FY26, projected EPS growth comes almost entirely from revenue, with net margin at 51–53%, gross margin at 84–86% and operating margin at 74–76%. HBM3E can lift revenue estimates without requiring further margin expansion.
Peers. The comparison set consists of the three incumbents—Samsung (SMSN), SK hynix (SKHX) and Micron (MU)—which hold the other 90% of DRAM revenue. CXMT (CXMT) ranks fourth, and it is the only one of the four with a growing share.
Valuation. All figures below are in US dollars at spot, and enterprise value is constructed on the same basis for all four names. CXMT (CXMT) requires two qualifications: it has no trading history to compare against, and minority partners in its fab subsidiaries account for roughly 30% of consolidated earnings and cash flow. The attributable rows therefore provide the relevant valuation basis for 688825 holders.
Catalyst Calendar
From 7 September through January, CXMT (CXMT) repeatedly comes back into focus around management's first public Q&A, Xiaomi's flagship launch, Huawei's HBM roadmap, Alibaba (BABA)'s accelerator conference, the reported Xi visit, peer earnings, index decisions and the first float expansion.
| Date | Event | Why it matters |
|---|---|---|
| September | ||
| Sep 4, 16:00 CST | Question cutoff for the interim briefing | Questions filed via the SSE roadshow pre-collection page or ir@cxmt.com are answered on the 7th. Submit the HBM3E timing question. |
| Sep 7, 14:30 CST | Huawei Mate XT2 tri-fold launch, Shenzhen | Tops out at 16 GB + 2 TB from an undisclosed memory supplier; the adjacent question is whose DRAM is inside. |
| Sep 7, 15:00–16:00 CST | 1H26 results briefing (SSE roadshow center) | First time management takes questions as a listed company; the venue to characterize HBM3E risk production, customer sampling and 2H capacity. |
| Sep 7, 19:00 CST | Xiaomi fall launch: 18 Fold, Pad 9 Pro Max, YU7/N-series cars | Lei Jun confirmed the date. The 18 Fold pairs Xiaomi's XRING O3 with 16 GB of CXMT (CXMT) LPDDR6; the first time a top-tier consumer brand puts CXMT (CXMT)'s name on a keynote slide. Retail availability is still "September". |
| Sep 9 | Apple (AAPL) iPhone event, including the first iPhone Fold | 12 GB of LPDDR5X from the incumbents, stacked on-package; the ~¥15k comparison point for the 18 Fold. |
| Sep 17–19 | Huawei Connect 2026, Shanghai | Ascend roadmap venue. The 950DT (4Q26) carries Huawei's HiZQ 2.0 HBM, 144 GB and 4 TB/s, with no disclosed die supplier. Any domestic-source disclosure is the named-customer catalyst. |
| Sep 22–24 | Alibaba (BABA) Apsara (Yunqi) Conference, Hangzhou | T-Head is one of two named HBM3E samplers; an accelerator announcement here is the second candidate for a qualification headline. |
| Sep 24 | Xi state visit to the White House | Return leg of the May Beijing summit; AI is on the agenda. Xi has every incentive to arrive with a demonstration of Chinese AI independence, and CXMT (CXMT) is the most valuable listed company in China. |
| Sep 30, after close | Micron (MU) FQ4 results and first FY27 outlook | Guide is about $50bn revenue and $31 non-GAAP EPS; the FY27 outlook sets the forward memory curve for the next quarter. |
| October – December | ||
| Early Oct | Samsung (SMSN) preliminary 3Q26 | First read on the quarter for the largest DRAM supplier. |
| Oct 27 | SK hynix (SKHX) 3Q26 results; CXMT (CXMT) three months listed | STAR Composite Index eligibility begins at three months. |
| Late Oct | Samsung (SMSN) 3Q26 results and board; Cambricon 3Q26 | Cambricon is the other named HBM3E sampler. |
| By Oct 31 | CXMT (CXMT) 3Q26 report | First full post-listing quarter; tests the 2H26 consensus of about ¥211bn revenue and a 51% net margin. |
| Dec 14 | STAR 50 inclusion (base case) | The Sep 11 rebalance passed without CXMT (CXMT); December inclusion would match SMIC's 2020 timeline. Passive buying against a 6.63% unrestricted tradable float. If missed, Mar 15, 2027. |
| January | ||
| Jan 27, 2027 | Institutional lockup expiry, 1.521bn shares | Adds about 34% to the currently tradable float; the hedging flow behind the perp carry in the Positioning section. |
| Politico reports Xi's one-day schedule through four people familiar; official confirmation remains pending. The May summit closed without substantive agreements, so the base case for the 24th is atmospherics. The 3Q26 date is the STAR Market deadline; CXMT (CXMT) has yet to reserve a date. | ||
HBM3E Catalyst
What it is. High-bandwidth memory takes DRAM and builds it vertically: eight or twelve DRAM dies are stacked on a logic die and connected through through-silicon vias. The assembly is mounted on a silicon interposer beside the processor, with the board-level alternative placing memory across the motherboard. HBM3E is the current shipping generation, providing 36 GB and roughly 1.2 TB/s per stack—ten to twenty times the bandwidth of a DDR5 module. Eight stacks sit around every NVIDIA (NVDA) B200 and feed the accelerator.
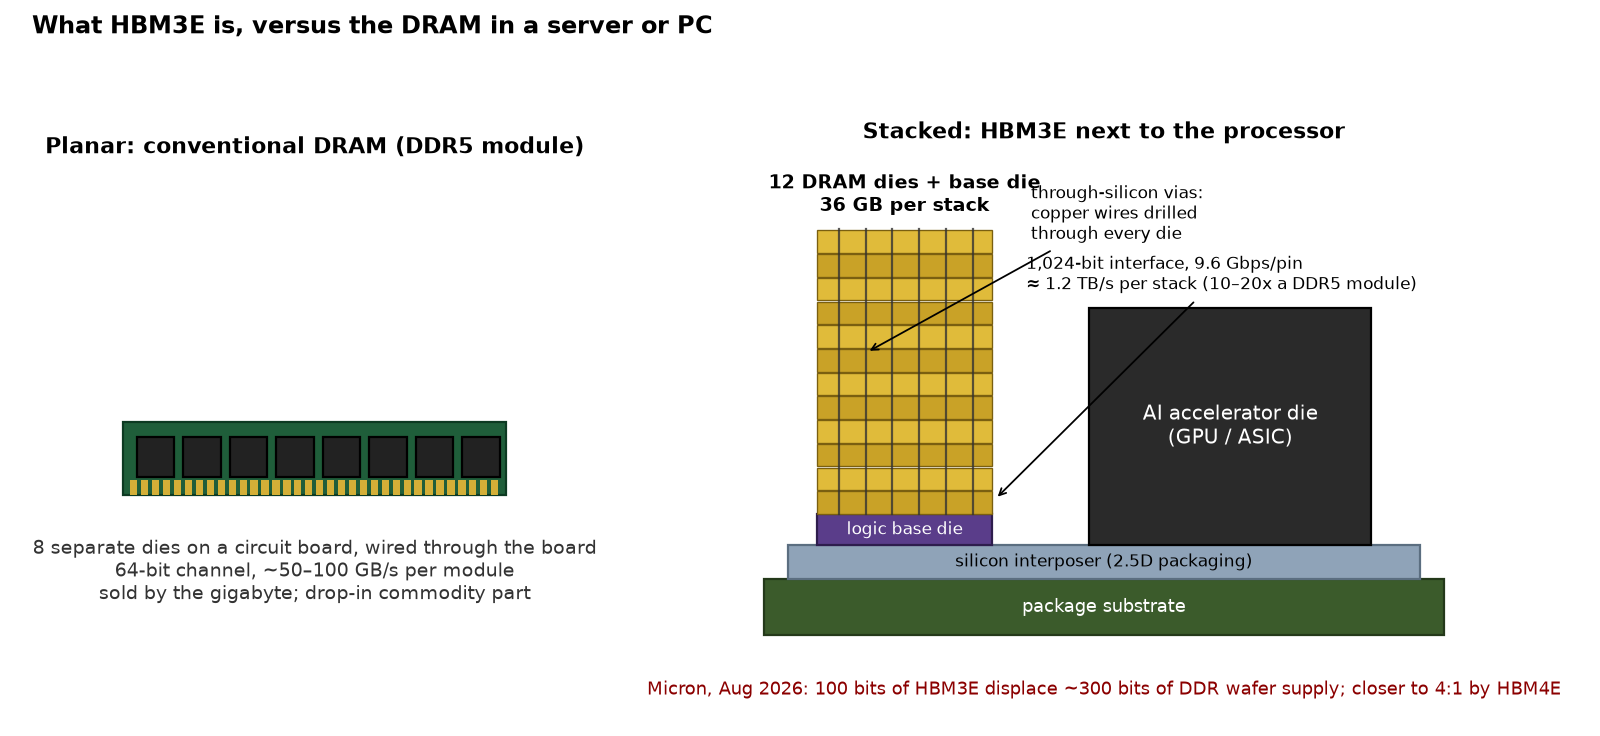
Why it matters. The shortage exists because HBM is absorbing wafer supply that would otherwise go to DDR. Sumit Sadana of Micron (MU) said in August 2026 that producing 100 bits of HBM3E requires the industry to give up about 300 bits of DDR wafer supply, with the ratio moving closer to 4:1 by HBM4E. Customers report that "the #1 constraint they have is DRAM", while Micron (MU) cannot fill more than half of data-center demand. HBM wafer input is 18% of DRAM wafers at end-2025, 22% at end-2026 and 30% at end-2027 (TrendForce). SK hynix (SKHX) said on its July call that the balance is unlikely "to improve meaningfully in the near term" because of process complexity and fab lead times. Device makers are carrying the bill. Tim Cook said on 30 July that Apple (AAPL) is "in a 100-year flood on the memory pricing", has "reluctantly raised prices", and is guiding gross margin from 49.3% to 46.5% over two quarters, with more than all of the change explained by memory. He added, "primarily the DRAM market has three suppliers. Obviously if there were more suppliers, that would be good." Every large buyer of memory now wants a fourth supplier, and CXMT (CXMT) is the only candidate.
The scale of the mix shift. CXMT (CXMT)'s current product mix is entirely conventional DRAM: LPDDR for phones accounts for about two-thirds of 2025 revenue, with DDR4 and DDR5 going to PCs and servers. TrendForce sizes that DRAM market at $619 billion in 2026 and $903 billion in 2027, and consensus capitalizes CXMT (CXMT)'s 7.7% share of that market. HBM, which is absent from CXMT (CXMT)'s current sales, represents a $35 billion market in 2025, about $60 billion this year and $100 billion by 2028 on Micron (MU)'s own TAM; Micron (MU) notes that this TAM is larger than the entire DRAM market of 2024. HBM consumes 30% of industry wafer starts by 2027, and its 2027 contract prices reset multiples higher. The HBM market alone exceeds CXMT (CXMT)'s entire FY26 consensus revenue. At SemiAnalysis's 100k wafers-a-month HBM capacity by 2028—roughly 12% of global HBM wafer share—even a yield-handicapped 5–10% of the 2028 HBM dollar TAM would produce $5–10 billion of revenue that current forward numbers omit.
| 2025 | 2026E | 2027E | 2028E | CXMT today | |
|---|---|---|---|---|---|
| DRAM, total (TrendForce) | 153 | 619 | 903 | — | 7.7% share; ¥361bn FY26E consensus ≈ $54bn |
| of which HBM (Micron (MU) TAM; Yole / TrendForce for 2026) | 35 | 60–62 | — | ≈100 | none; risk production Aug 2026 |
| HBM share of DRAM wafer starts (TrendForce) | 18% | 22% | 30% | — | 0%; 30k wspm target end-2026, 100k by 2028 (SemiAnalysis) |
| NAND, total (TrendForce) | 71 | 271 | 379 | — | YMTC serves NAND |
| Memory, total (TrendForce) | — | 889 | 1,280 | — | |
| TrendForce, 29 May and 2 Jun 2026 (2025 figures implied from stated growth rates: DRAM +303%, NAND +281%). Micron (MU) FQ1 2026 investor materials: HBM TAM ≈$35bn 2025 to ≈$100bn 2028, ≈40% CAGR. Yole Group, Chiplet Summit 2026: HBM ≈$60bn 2026. CXMT (CXMT) FY26E consensus converted at 6.72 CNY/USD. | |||||
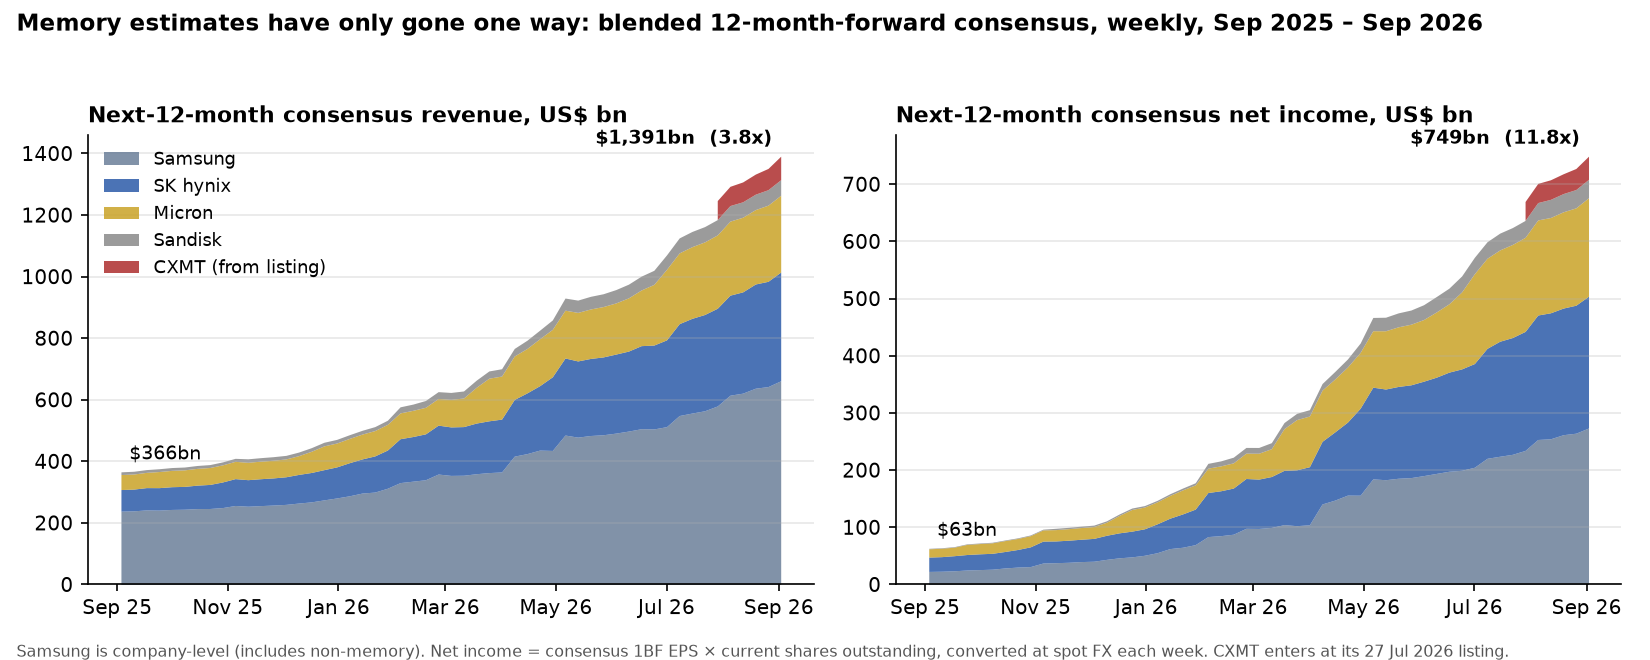
The estimates continue to move higher. Over the past year, blended next-twelve-month consensus revenue for the four incumbents rose from $366 billion to $1,315 billion, while net income rose from $63 billion to $709 billion. The CXMT (CXMT) listing adds a further $76 billion of revenue and $40 billion of earnings. CXMT (CXMT) is entering a market where estimates are rising and pricing power remains intact: it sells DDR5 and LPDDR5X at prices at or above those of the Big Three, and its LPDDR5X talks with Apple (AAPL) reportedly ended in August after CXMT (CXMT) held its price.
The Chinese inference bid. Domestic model usage creates structural Chinese demand for memory. On OpenRouter's leaderboard this week, 13 of the 20 most-used models are Chinese and they process 72% of the top-20 token volume (62 of 87 trillion tokens). GLM 5.3 Flash is tied for first at 11.4 trillion tokens, up more than tenfold week on week, while Z.ai (ZHIPU) says it runs entirely on Chinese AI chips. Every token served reads the model weights and a growing KV cache out of HBM and DRAM, so rising token volumes on domestic accelerators create a direct bid for domestic memory. Z.ai (ZHIPU) itself (2513 HK, listed 8 January 2026, HK$520 billion market cap) carries consensus revenue that triples in 2027 and more than doubles again in 2028; it trades at 28x forward sales, so the market is capitalizing Chinese inference at multiples that assume the memory to serve it exists.
| Measure | 2025 | 2026 | Change |
|---|---|---|---|
| HBM3E contract price, Samsung (SMSN) / SK hynix (SKHX) 2026 supply | base | ≈ +20% | +20% y/y⁶ |
| HBM3E premium over server DDR5 | 4–5x (2Q25) | 1–2x (end-2026E) | DDR5 caught up⁷ |
| HBM3E 36 GB stack, spot vs long-term-agreement price | — | $2,100 spot, 4–5x LTA | Sep 2026⁸ |
| HBM4 16-high stack, spot | — | ≈ $3,500 | Sep 2026⁸ |
| HBM contract prices, 2027 outlook | "multiples higher" | TrendForce, Jun 2026⁹ | |
| Contract prices are negotiated per customer and remain confidential; sources appear in the appendix. Conventional DRAM contract prices rose 93–98% in 1Q26 and 58–63% in 2Q26 (TrendForce), which is why the HBM premium compressed even as HBM prices rose. | |||
The September set-up. Management answers public questions on 7 September covering HBM3E yields, customers and timing. Ten days later at Connect, Huawei lays out the Ascend roadmap, and the 950 series ships with in-house packaged HBM from an undisclosed DRAM-die supplier. Five days later Alibaba (BABA) holds Apsara; Alibaba (BABA) is a CXMT (CXMT) shareholder, and its T-Head unit is sampling the part. Xi visits Washington on 24 September with AI on the agenda and a domestic memory champion behind him. We expect HBM3E to dominate the briefing; a capacity disclosure followed by a customer name at Connect or Apsara can move a company with a 6.63% unrestricted tradable float into the summit.
The Chinese independent hardware story. The 7 September consumer launch gives a direct read on where CXMT (CXMT) stands: in selected conventional DRAM products it has reached parity. Xiaomi's 18 Fold pairs its own 3 nm XRING O3 with 16 GB of CXMT (CXMT) LPDDR6. That standard is scheduled to reach Samsung (SMSN) and SK hynix (SKHX) alongside Qualcomm (QCOM)'s next Snapdragon, and CCTV Finance has already held up the combination as a template for Chinese semiconductor collaboration. Two days later Apple (AAPL) launches its own foldable with 12 GB of incumbent LPDDR5X stacked on-package while publicly complaining about DRAM cost. Huawei launches the Mate XT2 on the same afternoon as Xiaomi, and it tops out at 16 GB from an undisclosed supplier. Across three foldables launched in three days, the product evidence gives the fourth-supplier argument three price tags. CXMT (CXMT)'s HBM handicap is in stacking, TSVs and packaging yield; the underlying DRAM cell is further ahead.
| Xiaomi 18 Fold (Sep 7) | iPhone Fold (Sep 9) | |
|---|---|---|
| Memory | 16 GB CXMT (CXMT) LPDDR6, 113.8 GB/s | 12 GB LPDDR5X (Samsung (SMSN) / SK hynix (SKHX) / Micron (MU)), stacked on-package |
| SoC | XRING O3, TSMC (TSM) 3 nm | A20 Pro, TSMC (TSM) 2 nm |
| Inner / outer display | 7.58" / 5.38" (Xiaomi teaser) | 7.6–7.8" / 5.3–5.5" |
| Storage | up to 1 TB | 256 GB – 1 TB |
| Battery | ≈6,000 mAh, 67 W wired, 50 W wireless | undisclosed |
| Cameras | Leica, 200 MP main, telephoto | dual 48 MP, no telephoto |
| Modem | Qualcomm (QCOM) / MediaTek (TBC) | Apple (AAPL) C2 |
| Price | ≈¥12,000 start, all SKUs above ¥10k | $1,999–2,399; ≈¥14,999 China |
| Leak-sourced; neither company has published a spec sheet. Only the display sizes are from Xiaomi itself. Huawei Mate XT2 (Sep 7, 14:30): 16 GB + 2 TB top SKU, memory supplier undisclosed. One Weibo cost breakdown puts the 18 Fold's 12+256 memory kit at ¥2,200, up ¥1,700 on last year: the 100-year flood at the handset level. | ||
How CXMT (CXMT) caught up. Over three decades, state capital built the foundation. The National IC Fund II owns 7.7% of CXMT (CXMT), while Hefei's municipal vehicles and Anhui's provincial investment arm own a further 45.7%. State-linked holders therefore account for 53% of the shares, against an unrestricted tradable float of 6.63%. CXMT (CXMT) was founded in 2016 with neither a fab nor a research base, yet reached DDR5 production at volume in under a decade. YMTC followed a similar route in NAND and now ranks third globally. The route has also involved allegations concerning Samsung (SMSN) process technology. On 11 August 2026, a Seoul court heard sworn testimony from a former Samsung (SMSN) engineer, sentenced in April to seven years, that he sold CXMT (CXMT) Samsung (SMSN)'s roughly 600-step process recipe for about $2 million. Samsung (SMSN) says the recipe took five years and more than $1 billion to develop. The US prosecution of Fujian Jinhua lasted five years before an acquittal on every count. CXMT (CXMT) appears on the Pentagon's 1260H list, is challenging that designation in court, and remains absent from the Commerce Entity List.
The absence of EUV is what makes this remarkable. The incumbents are building HBM3E on 1a/1b-class nodes patterned with ASML EUV. ASML's July call links rising DRAM lithography intensity to customers replacing multi-patterning with single-exposure EUV, while buying memory tools at a rate up 75% this year. China cannot buy an EUV tool, and ASML's China revenue is 20% of sales, "mainly related to an increased demand in mainstream logic". CXMT (CXMT) is building its stacks on a 16 nm-class DUV multi-patterned node: its dies are about 40% larger, cost per bit is more than 30% above the Big Three, and estimated HBM3 8-high yields are around 25% (SemiAnalysis). HBM3E risk production on that toolset therefore requires brute force and leaves CXMT (CXMT)'s cost curve as the ceiling.
The structure of HBM is different from the rest of the memory business. Commodity DRAM is fungible, sold by the gigabyte, and a new fab expresses itself through price. HBM is qualified for a specific accelerator and packaged with it; customers order it 20–26 weeks ahead under multi-year take-or-pay agreements. Capacity therefore cannot simply be switched on, and the customer cannot switch supplier. HBM output consequently governs Chinese AI compute. Huawei's Ascend 910C relies on stockpiled Samsung (SMSN) and SK hynix (SKHX) HBM2E, which analysts expect to run out around mid-2026. The 950 series moves to Huawei-packaged HiBL and HiZQ memory, whose DRAM dies have no disclosed supplier. Alibaba (BABA)'s T-Head and Cambricon are sampling CXMT (CXMT) HBM3E for possible 2027 integration, and there is no other domestic source. CXMT (CXMT)'s HBM3E remains a generation behind and yield-constrained, leaving it as China's only domestic path beyond foreign stockpiles. Late-August risk production establishes the part, while named-customer volume qualification provides the catalyst.
Long Term Policy Support
Beijing has placed AI hardware inside a state investment mandate. The policy runs on three terms: self-reliance (自立自强), autonomous and controllable (自主可控), and the new whole-nation system (新型举国体制). Under that framework, memory is given a name, funding, and a fast track that extends from the Politburo down to the industrial statistics. The texts that follow move from Party doctrine through the Five-Year Plan to the State Council, with the level of specificity increasing at each stage.
| Date | Text | What it says | Maps to CXMT |
|---|---|---|---|
| 25 Apr 2025 | Politburo study session on AI (Xi) | Concentrate forces to break through core technologies including high-end chips and basic software; build an autonomous, controllable AI hardware and software foundation under the whole-nation system. Lists IP, fiscal and tax policy, government procurement and facility access as the tools.¹⁰ | The doctrinal basis for state capital in a DRAM maker. |
| 23 Oct 2025 | Fourth Plenum recommendations, 15th Five-Year Plan | Perfect the whole-nation system, adopt "extraordinary measures" (超常规措施) and drive decisive full-chain breakthroughs in integrated circuits; deploy major national S&T tasks around national strategic needs.¹¹ | Authorizes the capital and regulatory treatment CXMT (CXMT) then received. |
| 5 Mar 2026 | Government Work Report (Li Qiang) | Credits a breakthrough in self-developed chips alongside AI; IC output +10.9%. The January NBS release tied "AI+" to storage-chip output +22.8% and servers +12.6%.¹³ | The state counts memory output as an AI-policy metric. |
| 13 Mar 2026 | 15th Five-Year Plan Outline (NPC) | Part III: high-level S&T self-reliance, chapter 8 on key core technologies. Part IV: Digital China, chapter 12 on efficient supply of compute, algorithms and data. Embodied intelligence and humanoids enter the future-industries layout for the first time.¹² | Compute supply is read officially as high-end chip autonomy; sell-side readings list DRAM and HBM for full-chain localization. |
| 17 Jul 2026 | WAIC keynote (Xi) | "Safe, reliable and controllable" AI set as the second of four governing principles; the AI stack is to remain under Chinese control end to end.¹⁴ | Controllable means domestic; there is one domestic DRAM supplier. |
| Primary texts: Politburo readout (people.cn, 26 Apr 2025); Plenum recommendations (CCP, Oct 2025); Plan Outline (Xinhua, 13 Mar 2026); Government Work Report (5 Mar 2026); WAIC speech (news.cn, 17 Jul 2026). The DRAM/HBM localization reading comes from sell-side interpretation of the plan text. | |||
What it bought. On 30 December 2025, the SSE accepted CXMT (CXMT)'s filing at ¥29.5 billion. Seven months later, CXMT (CXMT) listed after raising ¥57.9 billion, the largest STAR IPO in history. The "national team" took ¥7.6 billion of the strategic tranche. The book included 36 Social Security Fund and basic-pension portfolios, the SOE Structural Adjustment Fund II, PICC and China Life. Alibaba Cloud (BABA), ZTE, Transsion, TCL, NIO, Chery, Xiaomi and Meituan were downstream strategic holders. CXMT (CXMT)'s own filing says the funds are directed in line with state policy support for ICs and pay for advanced memory R&D and capacity.¹⁵ Before the IPO, Hefei's platforms held 45%; today, state-linked holders own 53%, with the whole-nation system holding the equity directly.
Robotics is the second memory-intensive mandate. Three weeks after CXMT (CXMT), Unitree listed on the same board as the first humanoid stock and finished 460% higher. The Plan designates embodied intelligence a future industry, while NBS put 2025 industrial and service robot output up 44% and 80%, respectively.¹⁶ In June 2026, Micron (MU)'s Sanjay Mehrotra said a humanoid carries roughly ten times the memory of an L2+ car, that automotive and industrial grades price above mobile DRAM, and that this demand drives a decades-long cycle beginning around 2030. NVIDIA (NVDA)'s Jetson Thor humanoid board already carries 128 GB of LPDDR5X, against 12–16 GB in a flagship phone.¹⁷ CXMT (CXMT)'s ¥9 billion of proceeds earmarked for HBM and next-generation LPDDR5X are being read domestically as aimed at exactly that market, and NIO, Chery and Xiaomi are in its strategic book. The 17,000 humanoids shipped globally in 2025 carried about 2 PB of DRAM, against industry shipments of tens of exabytes. Robotics adds a long-dated option on 2030 volumes beyond the FY27–28 consensus window.
Why the premium can hold. Every other name in the DRAM peer set is cyclical, and the market pays 4–6x forward earnings for these businesses at the top of the cycle. CXMT (CXMT) carries a different status as a state-designated strategic asset, with only a 6.63% unrestricted tradable float, while its board trades at 50x forward earnings. Within a month of CXMT (CXMT)'s listing, a robotics IPO was priced at hundreds of times earnings. Our numbers in Table 4 place CXMT (CXMT) at 13.6x T+12m earnings: above SK hynix (SKHX), Micron (MU) and Samsung (SMSN); below STAR 50, Hang Seng TECH and the Nasdaq-100 (XYZ100); and at a fraction of Unitree. The policy record makes the domestic multiple the relevant anchor, while the state's demonstrated willingness to use extraordinary measures to keep the asset funded through the cycle reinforces that valuation.
Positioning
Why there is carry. The company's post-greenshoe filing shows 4.503 billion unrestricted shares, equal to 6.63% of shares outstanding. For 688825, the Hyperliquid perp is the only available hedge: there is no tokenized spot, ADR, options market, or usable securities lending. Institutional IPO allottees hold a further 1.521 billion shares at ¥8.66, locked until 27 January 2027; once those shares unlock, the current unrestricted tradable pool will rise by roughly 34%. That creates an unusual funding arrangement relative to every other TradeXYZ name: retail longs pay funding elsewhere, while here locked holders short the perp and the shorts pay.
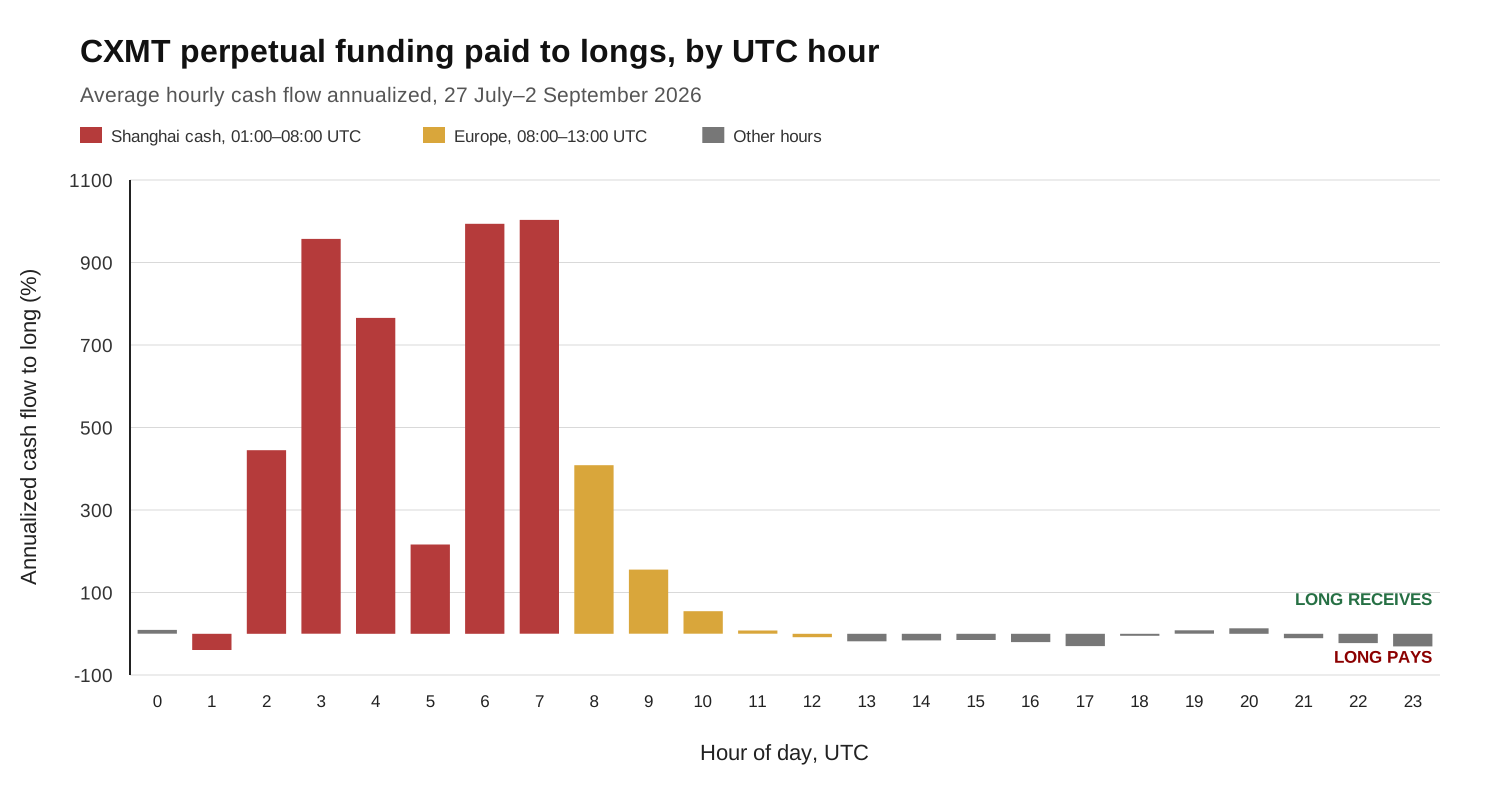
Where it accrues. Since listing, the perp has paid longs 20.9% in funding, with 18.8 points accruing during Shanghai cash hours (01:00–08:00 UTC), equivalent to about +620% annualized for the long. Funding during the US session was flat, and the timing is consistent with hedging against the live cash market.
| Session (UTC) | Hours | Cumulative, % of notional | Annualized |
|---|---|---|---|
| Shanghai cash 01:00–08:00 | 266 | 18.84% | 620% |
| Europe 08:00–13:00 | 190 | 2.68% | 124% |
| US 13:00–21:00 | 304 | (0.35%) | (10%) |
| Off-hours 21:00–01:00 | 152 | (0.24%) | (14%) |
| All hours | 912 | 20.93% | 201% |
| Long-cashflow convention: positive means the long receives funding from shorts; parentheses mean the long pays. Annualized = mean hourly funding × 8,760. | |||
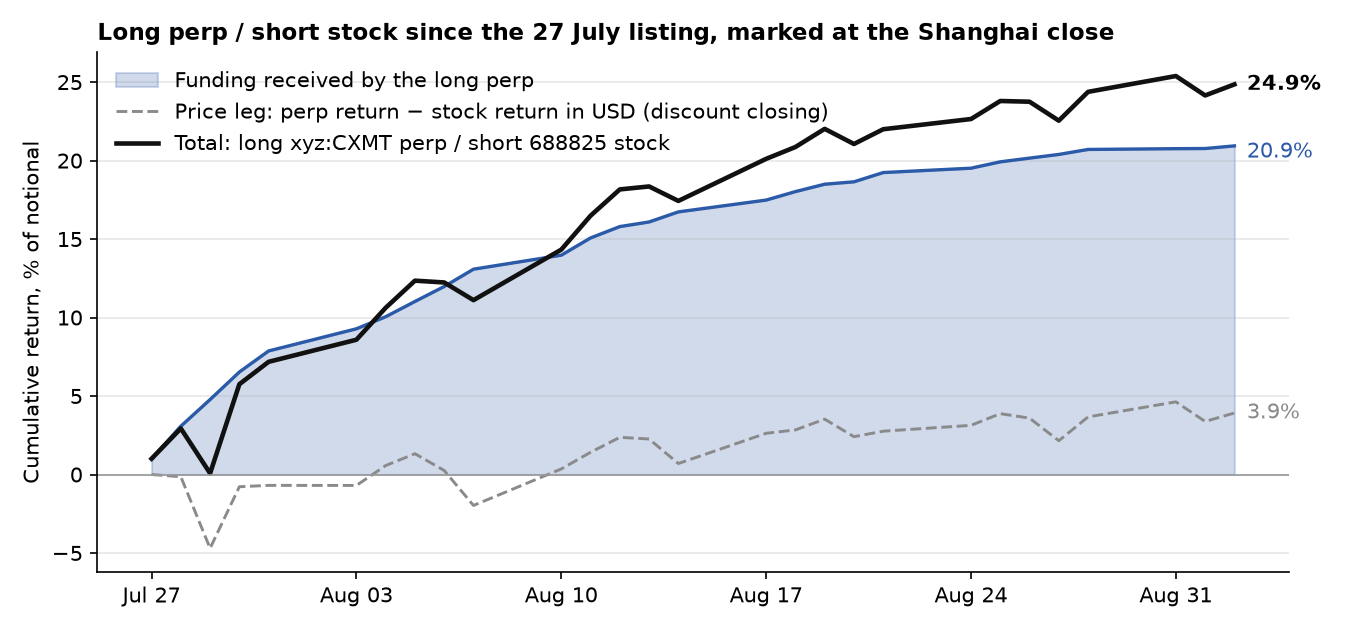
The historical basis trade through 2 September. Over the first 27 sessions, the long perp / short stock position returned 24.87%. Funding supplied 20.93 points of that result, while 3.94 points came from the perp discount moving from −4.1% to flat. Weekly funding reached 8.4% of notional at its peak and produced 0.7% in the seven days ending 2 September. The hedge on locked holders stays in place until January.
Expected carry. The 3 September daily model forecast a funding receipt to the long of 81.1% annualized over the next seven days, equivalent to 1.56% of notional over the forecast week. The forecast is produced by the validated seven-day estimator described in the appendix. Intraday observations feed the next scheduled model run; they do not independently constitute a reversal signal. Carry is forecast rather than locked, and the scenario table keeps it separate because the hold cases extend beyond the model horizon.
Risk Management
Realized volatility. The stock has run at 65% annualized since its second session across 28 trading days, with a maximum drawdown of 12% from the 17 August high. The perp also trades through the 17 hours each day that Shanghai is closed; it has run at 90% on daily closes and 78% over the last 30 days. The memory peers give you the longer regime history on public exchange data: Micron (MU) ran at 80% volatility, SK hynix (SKHX) at 90%, and SanDisk (SNDK) at 115% over the trailing twelve months. For position size, I would rely on those histories and treat CXMT (CXMT)'s first five weeks as a limited sample.
Realistic max drawdown. In this cycle, SK hynix (SKHX) fell 54% in 38 days from its June high, SanDisk (SNDK) fell 56% in 34 days and Samsung (SMSN) fell 41% in 42 days, a month before CXMT (CXMT) listed; the STAR-board post-IPO analogs produced comparable declines on their own board, with SMIC −41% in 55 days after its 2020 debut and Cambricon −63% over ten months. Across the peers' full histories, the worst 5% of three-month windows show 30–60% peak-to-trough drawdowns, and the median window shows 13–27%. That evidence leads us to plan for a 40–55% drawdown in the stock over the catalyst window as the realistic bad case: a loss of 1.4–1.9% of capital on the 3.5% leg, with a median-path loss nearer 0.7%. No funding credit is included in this drawdown budget.
| Window | Peak-to-trough | Days | Worst 5% of 63-day windows, full history | Median 63-day window | Vol, trailing 12m | |
|---|---|---|---|---|---|---|
| This cycle | ||||||
| SK hynix (SKHX) | Jun–Jul 2026 | (54%) | 38 | (60%) | (18%) | 90% |
| SanDisk (SNDK) | Jun–Jul 2026 | (56%) | 34 | (56%) | (26%) | 115% |
| Samsung (SMSN) | Jun–Jul 2026 | (41%) | 42 | (30%) | (13%) | 74% |
| Micron (MU) | Jan–Apr 2025 | (41%) | 73 | (48%) | (21%) | 80% |
| Last memory peak | ||||||
| Micron (MU) | May–Dec 2018 | (54%) | 209 | 43% | ||
| SK hynix (SKHX) | May 2018–Jan 2019 | (39%) | 225 | 35% | ||
| STAR-board post-IPO analogs | ||||||
| SMIC (688981) | Aug–Sep 2020, first year | (41%) | 55 | (29%) | (17%) | 58% |
| Cambricon (688256) | Jul 2020–May 2021, first year | (63%) | 291 | (42%) | (27%) | 72% |
| CXMT (CXMT) (688825) | Since 28 Jul 2026 | (12%) | 12 | — | — | 65% (28 days) |
| Daily closes through 3 Sep 2026. "Worst 5% of 63-day windows" is the 5th percentile of the maximum peak-to-trough drawdown inside every rolling 63-trading-day window over each name's listed history. Perp volatility for CXMT is 90% on daily closes since 27 Jul (78% trailing 30 days). | ||||||
Beta. We entered a short Cerebras (CBRS) leg, written up separately, against the 3.5% long CXMT (CXMT), with the sizing set to neutralize the pair's beta to the Nasdaq-100 (XYZ100). We measure that beta from Hyperliquid daily candles against the XYZ100 perp. CXMT (CXMT) runs at 1.6–1.7 beta to XYZ100 over 38 sessions, with 0.40 correlation; Cerebras (CBRS) runs at 2.75 over its full 126-session history and 3.8–3.9 over the last 60 sessions. Those readings put the neutral short at 1.5–2.0% of capital, and we are carrying 1.75% short CBRS against 3.5% long CXMT (CXMT), net beta about zero. Since the legs are 0.48 correlated, pair daily P&L volatility is 0.15% of capital, no higher than the CXMT (CXMT) leg alone. The adverse case we accept is a CXMT (CXMT)-specific break with a Cerebras (CBRS) squeeze: CXMT (CXMT) at −50% and Cerebras (CBRS) at +50% costs 2.6% of capital.
| Beta to XYZ100 | Corr | Sessions | Position | Beta × weight | |
|---|---|---|---|---|---|
| CXMT, since listing | 1.72 | 0.40 | 38 | +3.5% | +6.0 |
| CXMT, 8-hour candles | 1.44 | 0.34 | 113 | ||
| CBRS, full history | 2.75 | 0.47 | 125 | (1.75%) | (4.8) to (6.8) |
| CBRS, last 60 sessions | 3.78 | 0.70 | 60 | ||
| Pair | ≈ 0 | ||||
| Reference: MU | 3.07 | 0.72 | 258 | ||
| Log returns on daily closes; weekend sessions with a flat XYZ100 are excluded. XYZ100 realized volatility 21%. The CBRS beta has been rising, so the hedge is set between the full-sample and recent estimates and is re-struck weekly. | |||||
Resulting factor exposure. Once market beta is stripped out, the exposures are quite deliberate. The stock is up 6x from its offer price, so every momentum screen puts it at the top; when it breaks, those same screens will sell it. The memory-factor exposure comes through CXMT (CXMT)’s 0.48 correlation with Micron (MU) on the perp; the Cerebras (CBRS) short, itself 0.64 correlated with Micron (MU), hedges part of that exposure. The China exposure is policy and currency exposure through an A-share on the STAR board, paid in CNY, rather than the offshore China-tech factor: CXMT (CXMT) shows no loading there, with a correlation to BABA of −0.01 over the same 38 sessions. The short leg adds exposure against the US AI-compute IPO premium. In aggregate, the pair is approximately beta-neutral, long momentum, long memory, long onshore China, and short US AI-hardware froth; the long leg pays funding to us.
Investor Appetite
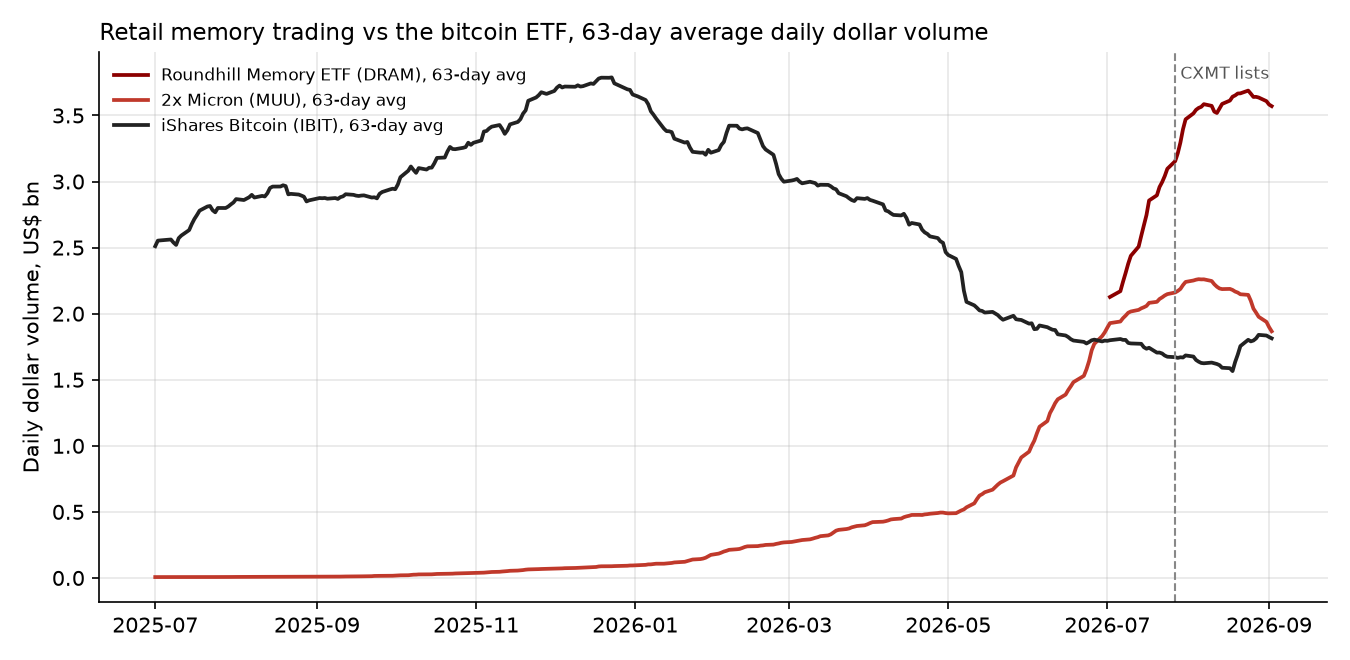
To see what drives a low-float name into an unlock, look first at the retail turnover that can be directed into a single instrument. The benchmark for that capacity is the iShares Bitcoin Trust: IBIT is the largest retail flow vehicle of the last cycle and trades $2–3 billion a day. Memory is now trading at that scale and above it in places. The Roundhill Memory ETF (DRAM) launched 2 April with CXMT (CXMT) at about 5% of the book via swap; July turnover reached $4.6 billion a day, 3.4 times IBIT, and August still ran at 1.1x IBIT. The 2x Micron ETF (MUU) went from $32 million a day in 2025 to $1.2 billion a day this year, while Micron (MU) itself went from $3.4 billion to $30 billion a day. Over the same period, IBIT fell from $2.9 billion to $2.2 billion. Memory is therefore drawing bitcoin-ETF-scale retail turnover against CXMT (CXMT)'s 6.63% unrestricted tradable float, with the January unlock giving marginal buyers a deadline.
| 2025 | Jan–Mar 26 | Apr–Jun 26 | Jul 26 | Aug 26 | Sep 26 (2 days) | |
|---|---|---|---|---|---|---|
| Roundhill Memory ETF (DRAM) | — | — | 2,020 | 4,604 | 2,430 | 1,276 |
| 2x Micron ETF (MUU) | 32 | 415 | 1,879 | 1,631 | 920 | 695 |
| Micron (MU) (MU) | 3,368 | 15,686 | 40,377 | 43,241 | 27,583 | 23,207 |
| iShares Bitcoin Trust (IBIT) | 2,882 | 2,906 | 1,793 | 1,365 | 2,207 | 1,774 |
| DRAM / IBIT | — | — | 1.1x | 3.4x | 1.1x | 0.7x |
| MUU / IBIT | 0.01x | 0.14x | 1.05x | 1.19x | 0.42x | 0.39x |
| Close × volume, averaged over trading days in each window, through 2 Sep 2026. DRAM launched 2 Apr 2026; its Apr–Jun figure is from launch. Tema Memory ETF (DISK), with the largest CXMT (CXMT) weight of any US ETF at 7.6%, trades about $10 mm a day and is omitted. | ||||||
Appendix A: Financial and Peer Comparisons
The figures and consensus run to 2 September 2026. Table 1 derives EPS from parent-attributable net income and 67.9 billion shares. Table 2 carries forward the published consensus EPS series and reports the net income and margin implied by it. The cash-flow tables retain the modeled bridge alongside the sell-side FCF estimate, with the methodology set out in the footnotes.
| FY23A | FY24A | FY25A | TTM Jun‑26 | FY26E | FY27E | FY28E | |
|---|---|---|---|---|---|---|---|
| Revenue | 9.1 | 24.2 | 61.8 | 196.7 | 361.4 | 587.4 | 762.2 |
| Revenue growth y/y | — | 166% | 156% | +874%¹ | 485% | 63% | 30% |
| Gross margin | (1.9%) | 5.6% | 41.0% | 76.6% | 85.4% | 85.5% | 84.4% |
| Δ bps y/y | — | 750 | 3,540 | +7,174¹ | 4,440 | 20 | (110) |
| Net income (parent) | (16.3) | (7.1) | 1.9 | 81.8 | 185.4 | 308.8 | 393.3 |
| Net margin | n/m | n/m | 3.0% | 41.6% | 51.3% | 52.6% | 51.6% |
| Δ bps y/y | — | — | — | +6,670¹ | 4,830 | 130 | (100) |
| EPS (CNY, parent NI / 67.9bn shares) | (0.24) | (0.11) | 0.03 | 1.20 | 2.73 | 4.55 | 5.79 |
| Reported columns (grey) from SSE filings; projected columns (blue) are sell-side consensus as of 2 Sep 2026. Parentheses denote negatives. ¹ 1H26 vs 1H25: revenue 150.3 vs 15.4; gross margin 84.7% vs 13.0%; net margin 51.6% vs (15.1%). FY26E deltas are vs FY25A. Net income is attributable to parent; 67.9bn shares. | |||||||
| TTM Jun‑26 | FY26E | FY27E | FY28E | |
|---|---|---|---|---|
| Consensus EPS (CNY) | 1.21 reported | 2.81 | 4.59 | 5.78 |
| × shares outstanding (bn) | 67.9 | 67.9 | 67.9 | 67.9 |
| = implied net income (bn) | 81.8 | 190.5 | 311.7 | 392.4 |
| ÷ consensus revenue (bn) | 196.7 | 361.4 | 587.4 | 762.2 |
| = implied net margin | 41.6% | 52.7% | 53.1% | 51.5% |
| Margin expansion vs TTM (bps) | — | 1,110 | 1,150 | 990 |
| Margin expansion vs FY25A (bps) | 3,860 | 4,970 | 5,010 | 4,850 |
| Implied EPS growth | — | 133% | 64% | 26% |
| CXMT | SK hynix | Micron | Samsung | |
|---|---|---|---|---|
| Scale | ||||
| DRAM revenue share, 2Q25 | 4% | 39% | — | — |
| DRAM revenue share, 2Q26 | 7% | 26% | 25% | 39% |
| Revenue, TTM (US$ bn) | 29.3 | 139.2 | 90.3 | 357.0 |
| Revenue, FY1E (US$ bn) | 53.8 | 257.2 | 129.3 | 537.0 |
| Revenue growth, TTM y/y (A) | 874%³ | 145% | 167% | 57% |
| Revenue growth, FY1E vs TTM | 84% | 85% | 43% | 50% |
| Revenue, FY2E (US$ bn) | 87.4 | 400.2 | 249.3 | 722.6 |
| Revenue growth, FY2E vs FY1E | 63% | 56% | 93% | 35% |
| Gross margin | ||||
| Last fiscal year (A) | 41.0% | 60.4% | 39.8% | 39.4% |
| TTM (A) | 76.6% | 76.3% | 72.6% | 57.5% |
| FY1E | 85.4% | 84.2% | 80.6% | 70.5% |
| FY2E | 85.5% | 84.4% | 86.1% | 75.8% |
| Δ bps, TTM vs last FY | 3,560 | 1,590 | 3,280 | 1,810 |
| Δ bps, FY1E vs TTM | 880 | 790 | 800 | 1,300 |
| Δ bps, FY2E vs FY1E | 18 | 20 | 550 | 530 |
| Net margin | ||||
| Last fiscal year (A) | 3.0% | 44.2% | 22.8% | 13.3% |
| TTM (A) | 41.6% | 85.6%² | 55.9% | 30.8% |
| FY1E | 51.3% | 72.4% | 64.3% | 42.2% |
| FY2E | 52.6% | 62.9% | 69.9% | 46.5% |
| Δ bps, TTM vs last FY | 3,860 | 4,140 | 3,310 | 1,760 |
| Δ bps, FY1E vs TTM | 970 | (1,320) | 840 | 1,130 |
| Δ bps, FY2E vs FY1E | 130 | (940) | 560 | 440 |
| Company-level figures; Samsung (SMSN) includes non-memory businesses (foundry, display, devices), so its margins understate the memory division. SK hynix (SKHX) is effectively pure memory. Micron (MU) fiscal year ends August: FY1E = FY Aug‑2026, FY2E = FY Aug‑2027; others are calendar. Native-currency figures converted at USD/KRW 1,359 and USD/CNY 6.72. CXMT (CXMT) net income is parent-attributable and trailing figures come from SSE filings; peer trailing figures are reported company data; projections are consensus as of 2 Sep 2026. ¹ DRAM revenue share per Counterpoint Research Global Memory Tracker, 2Q26 (the release omits Micron (MU) and Samsung (SMSN) 2Q25 shares). ² SK hynix (SKHX) 2Q26 net income (KRW 93.8tn on KRW 79.3tn revenue) includes a large non-operating gain; consensus net margin is the cleaner read. ³ CXMT (CXMT): 1H26 vs 1H25 (the prior-year interim needed for a TTM comparison is unavailable); peers are TTM to Jun‑26 versus the prior twelve months. | ||||
| CXMT | SK hynix | Micron | Samsung | STAR 50 | HS TECH | Nasdaq‑100 | |
|---|---|---|---|---|---|---|---|
| Size (US$ bn) | |||||||
| Market capitalization | 548.8 | 883.0 | 1,079.8 | 1,092.5 | 827.0 | 1,423.7 | 39,959.5 |
| + Net debt / (net cash) | (15.9) | (7.3) | 3.4 | (74.0) | — | — | — |
| + Minority interest (book) | 20.2 | 0.1 | 0.0 | 8.8 | — | — | — |
| = Enterprise value | 553.2 | 875.8 | 1,083.2 | 1,027.3 | — | — | — |
| Multiples | |||||||
| EV / sales, trailing | 18.9x | 6.3x | 12.0x | 2.9x | 8.4x | 0.9x | 6.5x |
| EV / sales, T+12m³ | 7.2x | 2.5x | 4.3x | 1.6x | 7.5x | 1.0x | 5.6x |
| P/E, trailing | 45.1x | 7.2x | 21.5x | 11.2x | 135.5x | 35.6x | 36.7x |
| P/E, FY1E | 19.4x | 4.7x | 13.1x | 5.3x | 64.6x | 21.8x | 25.2x |
| P/E, FY2E | 11.8x | 3.5x | 6.3x | 3.6x | 44.7x | 14.3x | 19.5x |
| P/E, T+12m | 13.6x | 3.8x | 6.3x | 4.0x | 49.7x | 16.2x | 21.1x |
| Free cash flow yield⁴ | |||||||
| Trailing 12m FCF yield | 3.1% | 7.7% | 2.4% | 10.2% | (0.3%) | 1.3% | 2.3% |
| T+12m FCF yield — net income bridge (Table 5) / index approximation⁵ | 8.8% | 23.0% | 12.5% | 26.8% | — | 2.8% | 4.1% |
| T+12m FCF yield — sell-side FCF estimate | 6.0% | 20.4% | 12.4% | 23.3% | — | — | — |
| CXMT (CXMT) parent-attributable FCF yield, trailing¹ | 2.2% | — | — | — | — | — | — |
| CXMT (CXMT) parent-attributable FCF yield, T+12m¹ | 6.6% | — | — | — | — | — | — |
| History, monthly 2016–2026² | |||||||
| Trailing P/E, median | — | 8.6x | 15.7x | 12.4x | 83.5x | 39.0x | 28.5x |
| Trailing P/E, 10th–90th percentile | — | 4.5x – 26.6x | 4.9x – 33.0x | 7.7x – 21.2x | 44.3x – 165.3x | 22.3x – 264.3x | 22.6x – 37.4x |
| Trailing P/E, 2018 cycle peak (median) | — | 4.5x | 5.3x | 7.3x | — | — | 25.3x |
| FCF yield, median | — | 3.9% | 1.2% | 6.1% | (0.6%) | 2.5% | 3.4% |
| FCF yield, 10th–90th percentile | — | (10.6%) – 10.9% | (7.8%) – 12.6% | 1.0% – 12.3% | (1.6%) – 0.5% | 1.2% – 4.5% | 2.4% – 4.8% |
| FCF yield, 2018 cycle peak (median) | — | 9.4% | 12.6% | 8.9% | — | — | 4.1% |
| EV / trailing sales, median | — | 2.1x | 2.5x | 1.0x | 6.0x | 1.2x | 4.4x |
| Prices and consensus as of 2 Sep 2026; USD/KRW 1,359, USD/CNY 6.72, USD/HKD 7.8. Enterprise value = market cap + total debt − cash and marketable securities + minority interest at book, computed identically for the four companies. CXMT (CXMT) balance sheet is 30 Jun 2026 from the interim report (cash and trading financial assets ¥182bn, borrowings ¥140bn, minority interest ¥136bn) plus an estimated ¥65bn of net July IPO proceeds. Trailing P/E is on parent-attributable EPS; forward P/E is consensus. Index columns are data-source aggregates: STAR 50 (Shanghai STAR Market, CXMT (CXMT)'s own board), Hang Seng TECH and the Nasdaq‑100. ¹ Minorities in CXMT (CXMT)'s fab subsidiaries took 28% of 1H26 net income (31% of the trailing twelve months), so consolidated FCF overstates what accrues to 688825 shareholders; the attributable rows scale FCF by the parent share and divide by market cap plus net debt. ² Monthly history of trailing P/E, trailing FCF yield and EV/sales. Companies and the Nasdaq‑100 run from Jan 2016; STAR 50 and Hang Seng TECH begin at index launch (Aug 2020), so their 2018 rows are blank. The 2018 rows are the median of that calendar year, the last DRAM peak. CXMT (CXMT) listed in July 2026 and has no history. ³ For indices the T+12m row uses consensus price/sales rather than EV/sales. ⁴ Company FCF yields are on enterprise value; index FCF yields are the aggregate trailing free cash flow over market capitalization. ⁵ Index T+12m FCF yield approximates FCF growing in line with consensus earnings: trailing FCF yield × trailing P/E ÷ T+12m P/E. STAR 50 trailing FCF is negative, leaving the forward field blank. | |||||||
| CXMT | SK hynix | Micron | Samsung | |
|---|---|---|---|---|
| Trailing 12 months (reported) | ||||
| Net income margin (consolidated) | 60.4% | 85.6% | 55.9% | 30.8% |
| + Non-cash items and working capital (CFO − NI)³ | 22.7% | (18.5%) | 1.1% | 9.7% |
| = Operating cash flow margin | 83.1% | 67.1% | 57.0% | 40.5% |
| − Capital expenditure | 24.0% | 18.6% | 28.0% | 11.0% |
| = Free cash flow margin | 59.1% | 48.5% | 29.0% | 29.5% |
| FCF / net income (cash conversion) | 97.8% | 56.6% | 51.9% | 95.6% |
| FCF, trailing (US$ bn) | 17.3 | 67.5 | 26.2 | 105.3 |
| T+12m (consensus net income, D&A and capex; working capital neutral) | ||||
| Net income margin (consolidated)⁴ | 72.4% | 65.2% | 69.8% | 45.4% |
| + Depreciation and amortization⁵ | 8.0% | 3.4% | 2.7% | 6.2% |
| − Capital expenditure | 16.5% | 11.6% | 18.1% | 9.9% |
| = Free cash flow margin | 64.0% | 57.0% | 54.4% | 41.7% |
| FCF, T+12m (US$ bn) | 48.9 | 201.2 | 135.8 | 275.7 |
| Sell-side FCF estimate, T+12m (US$ bn) | 33.3 | 178.4 | 134.5 | 239.0 |
| FCF yield on EV, T+12m | 8.8% | 23.0% | 12.5% | 26.8% |
| Margin change, T+12m FCF vs trailing (bps) | 492 | 849 | 2,541 | 1,218 |
| T+12m is the blended next-twelve-month consensus (one third FY1E, two thirds FY2E for calendar reporters). ³ CFO − net income captures D&A, non-cash gains and working capital; SK hynix (SKHX) is negative because its 2Q26 net income includes a large non-cash gain. ⁴ CXMT (CXMT) consensus net income is parent-attributable; it is grossed up to consolidated using the 1H26 parent share (72%) so the bridge matches consolidated cash flow. ⁵ Consensus D&A is the EBITDA − EBIT gap; where EBITDA coverage is thin (SK hynix (SKHX), Micron (MU)) it understates D&A and therefore FCF. | ||||
Appendix: forward-funding model
The model forecasts the long’s annualized funding cashflow over the next 24 hours and the next 7 days. At ingestion, it converts the exchange sign so that every rate in the article follows one convention: a positive rate means the long receives funding. The inputs are the contract’s realized hourly funding history from Hyperliquid, with trailing means over 24, 72, 168, 336 and 720 hours recomputed at each daily decision point.
Each day the forecast is republished on every Corbanu market page in the "T+7d funding APR" column and fed into the total-return index, which scales prior perp levels by realized hourly funding. Behind that output sit three estimators: a 1-day persistence, a 50/50 blend of the 1-day and 7-day means, and a ridge regression on the 1-day to 30-day means, fitted per contract with walk-forward validation. The selection was made by sweeping every standalone window from 1 to 30 days and 16 coarse-grid blends—1d, 3d, 7d, 14d, 30d, all pairwise 50/50 blends, and their equal-weight average—across 22 contracts with at least 45 common daily observations, scoring the candidates on identical dates and equal-weighting them across contracts. For the 7-day horizon the 7d/30d blend is used; it delivers 80.6% sign accuracy, with flip precision of 66% and recall of 59% for calls in which the sign changes relative to the preceding 24 hours, and a mean absolute error of about 13 percentage points annualized. For the 24-hour horizon the per-contract ridge is used once 45 daily observations exist; before that, the 1d/1w blend is used. CXMT (CXMT), listed on 27 July 2026, remains inside the short-history window for the 24-hour model.
Appendix: sources for the HBM3E section
⁶ Chosun Biz via TrendForce, 24 Dec 2025: Samsung (SMSN) and SK hynix (SKHX) raised HBM3E supply prices by nearly 20% for 2026. ⁷ TrendForce, 29 Oct 2025 and 18 Dec 2025: HBM3E premium over server DDR5 more than 4x in 2Q25, expected to narrow to 1–2x by end-2026. ⁸ Seoul Economic Daily via TrendForce, 1 Sep 2026: 36 GB HBM3E at about $2,100 on the spot market, four to five times LTA; 16-high HBM4 about $3,500. ⁹ TrendForce, 2 Jun 2026: HBM wafer input 18% / 22% / 30% of DRAM wafers at end-2025 / 2026 / 2027; HBM contract prices expected to rise multiples higher in 2027. Conventional DRAM contract price moves: TrendForce quarterly contract-price reports, 1Q26 and 2Q26. Company quotations are from the Apple (AAPL) fiscal 3Q26 earnings call (30 Jul 2026), the Micron (MU) presentation at the KeyBanc Technology Leadership Forum (10 Aug 2026), the SK hynix (SKHX) 2Q26 earnings call (29 Jul 2026) and the ASML 2Q26 earnings call (15 Jul 2026). CXMT (CXMT) HBM yield and node estimates: SemiAnalysis; risk-production report: The Information, 31 Aug 2026; Seoul court testimony: Korean press reports of the 11 Aug 2026 hearing; shareholder and lockup data: CXMT (CXMT) 2026 interim report and IPO result announcement.
Appendix: sources for the policy section
¹⁰ Politburo collective study session on AI, readout via people.cn, 26 Apr 2025. ¹¹ CCP Central Committee recommendations for the 15th Five-Year Plan, Fourth Plenum, 23 Oct 2025. ¹² Outline of the 15th Five-Year Plan, adopted 13 Mar 2026 (Xinhua); NDRC and CPPCC readings of chapters 8 and 12; sell-side plan notes on storage-chip localization (interpretation). ¹³ 2026 Government Work Report, 5 Mar 2026; NBS, Jan 2026 industrial output release. ¹⁴ Xi Jinping, WAIC keynote, news.cn, 17 Jul 2026. ¹⁵ Caijing on the strategic tranche; CXMT (CXMT) strategic-allocation filing and prospectus (SSE), Jul 2026; SSE filing acceptance 30 Dec 2025. ¹⁶ Unitree STAR listing, 19 Aug 2026; NBS 2025 robot output; Galaxy Securities plan note on embodied intelligence. ¹⁷ Micron (MU) FQ3 2026 earnings call, Jun 2026 (Mehrotra on humanoid memory content); NVIDIA (NVDA) Jetson Thor specifications; Unitree prospectus (5,511 units shipped in 2025).
Important Notice
This memorandum sets out research commentary and a model-portfolio decision; it provides no personalized investment advice and constitutes no offer to buy or sell securities or derivatives. CXMT (CXMT) and Cerebras (CBRS) are highly volatile. Perpetuals introduce funding, leverage, liquidity, oracle, counterparty and venue risks. Forecasts and estimates may be wrong.
Corbanu · Updated 4 September 2026 · Entry recorded from the Hyperliquid venue mid at 20:09:40 UTC; other information and estimates are dated as stated in the article.