 Corbanu
Long Kioxia, Short the Nikkei: AI Storage at Four Times Forward Earnings
CORBANU · TRADE NOTE · 15 SEPTEMBER 2026
Proposed exposure: up to 3.0% long Kioxia / 8.5% short JP225
Cash reference: ¥51,750, Tokyo close on 15 September, pre-split
Likely implementation: spot Kioxia shares against a Nikkei short, as a core long/short position
Main reassessment: Kioxia results expected 13 November 2026
Market prices refer to 15 September 2026; funding observations extend through 23:00 UTC. Bloomberg forecasts were retrieved on 15–16 September.
Unless stated otherwise, yen prices and EPS are pre-split. Kioxia has announced a three-for-one split with a 30 September record date and a 1 October effective date. Once effective, cash-market prices and EPS will divide by three, while shares will multiply by three: the ¥51,750 reference becomes ¥17,250. Split notice
1. Why Put This Trade On Now?
Kioxia trades at 4.18× next-12-month earnings while consensus expects revenue to grow 331.4% in the year ending March 2027. We think that multiple is unjustifiably low for a business whose customers are starting to commit to years of supply. The shares are 52.4% below their June closing high, just as AI storage is becoming a larger spending priority and the industry is changing how it sells NAND.
At its 13 August Investor Day, Sandisk reported agreements with eight customers covering approximately half of FY2027 bit volume and two-thirds of FY2028 volume. They include committed volumes, minimum financial guarantees and structured pricing. Sandisk Investor Day
CEO David Goeckeler described the speed of the change:
“Within 2 quarters, we've gone from 3 months of visibility to over 4 years of visibility.”
Customers are now proposing three- and five-year deals themselves, he said. Investor Day webcast; transcript supplied
Multi-year commitments and financial guarantees weaken the case for valuing NAND as a one-year profit spike. Sandisk is targeting roughly 75% non-GAAP operating margins and 50% adjusted free-cash-flow margins for FY2028–2030. Kioxia is targeting long-term agreements for 50% of calendar-2028 shipments; unlike Sandisk's coverage, that remains a target rather than a signed contract book. Sandisk financial targets, Kioxia presentation, p. 17
The timing comes from the increased focus on SSDs in AI inference. DeepSeek's 10 September release explicitly measures persistent SSD-cache requirements; NVIDIA and storage vendors are building systems around reusable AI context.
The upside case does not require Kioxia to beat consensus. Our central EPS estimate for the year ending March 2028 is 25.7% below the Street and still leaves the stock at approximately 4.74× earnings. Waiting for every contract to be signed and every estimate confirmed risks paying a higher multiple for the same earnings.
Kioxia Versus the Nikkei: Valuation
The Nikkei short offsets part of the Japanese-market exposure while selling a higher multiple on slower earnings growth. The table uses Bloomberg's blended next-12-month estimates; its FY1-to-FY2 EPS growth figures are distinct from the current-year revenue growth above.
| Measure | Kioxia | Nikkei 225 |
|---|---|---|
| Closing price / index level | ¥51,750 | 63,484 |
| Next-12-month P/E | 4.18× | 20.11× |
| Forward earnings yield | 23.9% | 5.0% |
| Next-fiscal-year P/E | 4.97× | 20.62× |
| Following-fiscal-year P/E | 3.52× | 19.90× |
| Consensus EPS growth, FY1 to FY2 | 41.2% | 3.6% |
| Kioxia discount to the index multiple | 79.2% | — |
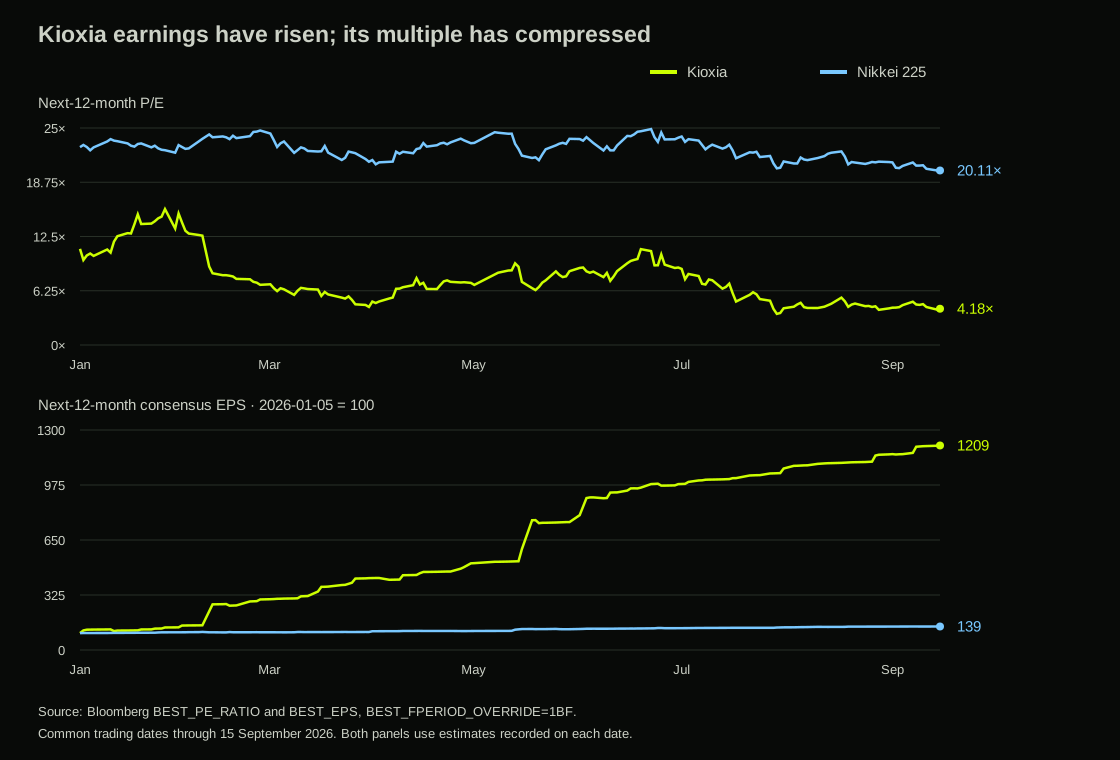
Using Bloomberg daily history through 15 September 2026, the chart shows next-12-month P/E in the top panel and next-12-month consensus EPS in the bottom panel, rebased to 100 at the first common trading session of 2026; both use BEST_FPERIOD_OVERRIDE=1BF, with estimates recorded on each date.
2. What Kioxia Sells
Kioxia's business is concentrated in NAND and SSDs, with manufacturing in Japan alongside Sandisk. The proposed position therefore has direct exposure to flash pricing and enterprise-storage demand.
Business mix
| June-quarter revenue | ¥bn | Share |
|---|---|---|
| SSD & Storage | 1,174.7 | 66.5% |
| Smart Devices | 525.7 | 29.7% |
| Other | 66.7 | 3.8% |
| Total | 1,767.1 | 100.0% |
Datacentre and enterprise applications generated over 60% of SSD & Storage revenue, while PCs contributed slightly below 40%. The percentages use segment revenue as the denominator. Company presentation, p. 10
For the fiscal year ended March 2026, Apple accounted for ¥476.0 billion, or 20.4% of sales. Sandisk and Dell accounted for 11.6% and 10.0% in the preceding fiscal year, while both fell below the disclosure threshold in the year ended March 2026. Revenue by customer geography was approximately 47% United States, 16% China and 13% Taiwan. Annual securities report
Buyback and Investment
In August, Kioxia spent ¥800 billion buying back 16.13 million shares, equivalent to about 2.94% of June-end issued shares, at an average price of ¥49,586. Buyback completion
3. Earnings and Forecasts
June-quarter IFRS operating profit exceeded the entire preceding fiscal year's result.
Management reported approximately 70% QoQ growth in dollar-denominated ASPs, with like-for-like and blended pricing broadly aligned. Low-single-digit bit-shipment growth accompanied that move, leaving the earnings surge predominantly price-led. Realised ASPs therefore provide the central test of profit durability. Company presentation, p. 9
Financial Model
The columns cover full fiscal years ending in March, with all figures in ¥billion except EPS.
| Reported | Bloomberg consensus | |||
|---|---|---|---|---|
| Year ending March | 2026A | 2027E | 2028E | 2029E |
| Sales | ||||
| Revenue | 2,337.6 | 10,084.2 | 13,522.8 | 15,346.3 |
| Revenue growth | — | 331.4% | 34.1% | 13.5% |
| Gross margin | 43.3% | 82.7% | 83.8% | 82.9% |
| Profit | ||||
| EBITDA | 1,183.2 | 8,386.3 | 11,430.1 | 12,799.8 |
| EBITDA margin | 50.6% | 83.2% | 84.5% | 83.4% |
| Operating profit / EBIT | 870.4 | 7,993.8 | 10,983.4 | 12,401.3 |
| Operating-profit growth | — | 818.4% | 37.4% | 12.9% |
| Operating margin | 37.2% | 79.3% | 81.2% | 80.8% |
| Net income | 554.5 | 5,605.3 | 7,736.5 | 8,749.5 |
| Net-income growth | — | 910.9% | 38.0% | 13.1% |
| Net margin | 23.7% | 55.6% | 57.2% | 57.0% |
| Per Share and Valuation | ||||
| EPS, ¥ | 1,024.1 | 10,411.6 | 14,703.7 | 17,305.3 |
| EPS growth | — | 916.7% | 41.2% | 17.7% |
| Forward P/E at ¥51,750 | — | 4.97× | 3.52× | 2.99× |
| Investment | ||||
| Capital expenditure | 281.1 | 454.2 | 547.3 | 616.0 |
| Capex / revenue | 12.0% | 4.5% | 4.0% | 4.0% |
| A = reported; E = consensus. Growth compares consecutive full years. Reported IFRS and Bloomberg adjusted estimates can differ in accounting treatment. P/E uses each full year's EPS, not trailing-12-month EPS. Source: Bloomberg; original forecasts retrieved 15 September, refreshed unchanged 16 September. Gross-margin estimates added 16 September. | ||||
June-quarter revenue reached ¥1,767.1 billion, up 76.2% QoQ. IFRS operating margin was 71.9%, while net margin was 47.7%. Operating cash flow was ¥866.3 billion; after ¥51.2 billion of cash capex, ¥815.2 billion remained. June-quarter filing
September-quarter guide versus expectations
| Metric, ¥bn | Company IFRS guide | Company non-GAAP guide | Bloomberg BEst consensus |
|---|---|---|---|
| Revenue | 2,390.0 | 2,390.0 | 2,472.9 |
| Operating profit / EBIT | 1,890.0 | 1,900.0 | 1,973.2 |
| Net income | 1,270.0 | 1,280.0 | 1,375.6 |
The company issued its guide on 31 July, based on a quarterly-average USDJPY of 162.
Bloomberg BEst carries sales 3.5% above company guidance. On the same comparison, EBIT is 4.4% above IFRS guidance and 3.9% above non-GAAP guidance, while net income is 8.3% and 7.5% above the respective figures.
The second-half bridge
The June IFRS-to-non-GAAP operating-profit bridge is:
| June operating-profit bridge | ¥bn |
|---|---|
| IFRS operating profit | 1,270.0 |
| Purchase-price amortisation | 0.2 |
| Stock remuneration | 19.4 |
| Litigation expense | 36.6 |
| Non-GAAP operating profit | 1,326.2 |
June non-GAAP profit and September non-GAAP guidance produce the following illustrative full-year bridge:
Assuming comparable annual BEst and non-GAAP definitions, the bridge leaves ¥2,383.8 billion per remaining quarter, 25.5% above September guidance.
The consensus forecast holds operating margins near 79–81% through March 2029.
Balance sheet and cash generation
The balance sheet at 30 June showed:
- Cash stood at ¥791.0 billion.
- Bonds and borrowings stood at ¥634.6 billion.
- Using rounded figures, net cash before leases was approximately ¥156.4 billion.
- Lease liabilities of ¥203.3 billion resulted in approximately ¥46.9 billion of net debt, also using rounded figures.
- PP&E stood at approximately ¥1,055.8 billion.
- During the quarter, the cash-flow statement recorded ¥433.2 billion in repayments of long-term borrowings.
The ¥800 billion August buyback followed the June balance-sheet figures.
The indicative Bloomberg USD bond mids were 101.393 for the 6.25% July-2030 note and 102.303 for the 6.625% July-2033 note; the corresponding yields were approximately 5.84% and 6.21%.
4. What Kioxia Is Worth
The table sets out the March-2028 earnings implied by different NAND-price outcomes. Each case starts with March-2027 consensus sales and costs, then varies shipments, selling prices, cost per bit and FX. The model assumes net income equals 70% of EBIT and uses 532.505 million shares, excluding treasury shares, from the 31 August filing. Appendix A contains the calculations.
Operating Scenarios: Year Ending March 2028
| Input or output | Rebalancing bear | Central | Persistent-tightness bull |
|---|---|---|---|
| Assumptions versus year ending March 2027 | |||
| Bits shipped | +10% | +20% | +30% |
| Realised dollar price per bit | −35% | −10% | +5% |
| Variable cost per bit | −10% | −15% | −20% |
| USDJPY | 145 | 155.10 | 162 |
| Derived financials, ¥bn | |||
| Revenue | 6,453.6 | 10,427.1 | 13,764.9 |
| Operating costs | 2,074.7 | 2,121.8 | 2,153.1 |
| EBIT | 4,378.9 | 8,305.3 | 11,611.8 |
| EBIT margin | 67.9% | 79.7% | 84.4% |
| Net income at 70% of EBIT | 3,065.2 | 5,813.7 | 8,128.3 |
| EPS, ¥, rounded | 5,756 | 10,918 | 15,264 |
| Assumed valuation multiple | 5× | 6× | 8× |
| Price from rounded EPS | ¥28,780 | ¥65,508 | ¥122,112 |
| Change from ¥51,750 | −44.4% | +26.6% | +136.0% |
The central case applies a 6× earnings multiple, close to Micron and Sandisk's multiples on their second forecast year. The bear case is valued at 5× and the bull case at 8×.
The bull case produces EPS 3.8% above consensus, requiring a more favourable combination of price, bits, cost reduction and currency.
Margin Sensitivity in Our Model
Holding our shipment, cost and currency assumptions fixed, an 81.2% operating margin requires approximately ¥11,286 billion of revenue against ¥2,121.8 billion of costs. That corresponds to a 2.6% dollar-price decline, versus the 10% decline in our central case.
This is a sensitivity within our model, not an estimate of the pricing embedded in consensus. The Street projects ¥13,522.8 billion of revenue and ¥10,983.4 billion of EBIT for the year ending March 2028, implying ¥2,539.4 billion of costs. Its higher revenue and different cost base could reflect different shipment, pricing, mix, currency and efficiency assumptions; the aggregate estimates do not identify those inputs.
Cash-flow scenarios and the joint-venture burden
The cash cases use EBIT-to-operating-cash-flow conversion rates of 50% for bear, 60% for central and 70% for bull. Tax, working capital and non-cash charges are captured within those single-rate sensitivities.
For the cash analysis, the ¥547.3 billion consensus capex figure for the year ending March 2028 provides the baseline. Incremental shared-manufacturing cash calls are then set at ¥500.0 billion, ¥333.3 billion and zero, respectively. These assumptions stress cash obligations not already captured in baseline capex.
| Scenario cash flow, ¥bn | Bear | Central | Bull |
|---|---|---|---|
| Assumed OCF / EBIT | 50% | 60% | 70% |
| Modelled operating cash flow | 2,189.4 | 4,983.2 | 8,128.3 |
| Baseline capex | 547.3 | 547.3 | 547.3 |
| Additional JV cash-call assumption | 500.0 | 333.3 | 0.0 |
| Cash after these investment outflows | 1,142.1 | 4,102.6 | 7,581.0 |
| Cash after investment / ¥27,557.1bn equity value | 4.1% | 14.9% | 27.5% |
Memory-Sector Valuations
The 11 September filing reports 548,639,034 issued shares and 16,134,027 treasury shares at 31 August, leaving 532,505,007 shares excluding treasury. At the ¥51,750 reference price, that gives a reconstructed equity value of ¥27.5571 trillion. We use this filed denominator for the house EPS model and cash-to-equity ratios, with no assumed subsequent issuance or repurchases. Bloomberg's consensus EPS and P/E series remain unchanged. Treasury-share filing, p. 3; archived copy
| Company | Second-forward-fiscal-year P/E | Business mix |
|---|---|---|
| Kioxia | 3.52× | Concentrated NAND and SSD exposure |
| Samsung Electronics | 3.55× | Diversified electronics and memory |
| SK hynix | 3.62× | DRAM/HBM and NAND |
| Sandisk | 5.87× | Flash-focused |
| Micron | 6.06× | DRAM/HBM and NAND |
Each company’s multiple is calculated against its own fiscal calendar.
At the ¥51,750 reference price, Bloomberg's trailing EPS of ¥2,525.12 puts Kioxia on 20.49× trailing earnings. The market's 4.18× next-12-month P/E reflects the expected earnings increase.
| March-2028 EPS sensitivity | 4× | 6× | 8× | 10× |
|---|---|---|---|---|
| Consensus unchanged | ¥58,815 | ¥88,222 | ¥117,630 | ¥147,037 |
| Cut by one-third | ¥39,210 | ¥58,815 | ¥78,420 | ¥98,025 |
| Cut by one-half | ¥29,407 | ¥44,111 | ¥58,815 | ¥73,519 |
With March-2028 consensus EPS reduced by one-half, today’s price implies 7.04× earnings. The ¥115,829 analyst target implies 11.82× earnings after a one-third reduction in EPS.
5. How AI Increases SSD Demand
What is already visible
Counterpoint estimates that enterprise SSDs rose from 26% to 48% of NAND bit shipments in one year.
TrendForce estimates top-five enterprise SSD revenue rose 103.6% sequentially to $37.59 billion in Q2 2026, reflecting pricing, mix and shipments.
Sandisk's fiscal quarter ended 3 July generated $2.977 billion of datacentre revenue, up 103% sequentially, while full-year datacentre revenue growth reached 437%. Micron's fiscal Q3 prepared remarks put datacentre SSD revenue above $5 billion. Counterpoint, TrendForce enterprise SSD estimate, Sandisk results, Micron remarks
External demand forecasts give the thesis scale
Kioxia's 2 June Investor Day, citing TechInsights, forecast 2025–2028 annual demand growth of 22% for total flash, 46% for datacentres and 86% for inference within datacentres. These are nested categories, not additive markets. Kioxia Investor Day, slide 15
Sandisk's separate forecast puts the enterprise datacentre flash market at 1.2 zettabytes by 2030. Sandisk Investor Day
More Efficient Models Need Less Storage per Task
DeepSeek's 10 September V4.1 Flash announcement claims its KV cache requires one-quarter of the HBM and one-eighth of the SSD storage of its predecessor. SSDs complement active GPU memory; they do not replace it. The efficiency gain also means fewer storage bytes per comparable workload. DeepSeek announcement
For the SSD-cache component affected by that efficiency gain:
This eightfold hurdle applies to the affected cache component, not all NAND.
A whole-market sensitivity
Set total NAND demand at 100, using the estimated Q2 mix of 48 enterprise and 52 non-enterprise.
Illustrative next-period analysis uses the following assumptions:
- The efficiency-affected cache component is modelled at 20% of enterprise NAND demand, or 9.6% of total demand.
- Other enterprise demand is assumed to grow 20%.
- Non-enterprise demand is assumed to decline 5%.
- Replacement and inventory effects remain constant.
The affected share enters the model as a scenario assumption; market statistics provide no direct measurement.
| Assumed workload factor G | Affected cache capacity versus baseline | Total NAND demand index | Total demand growth |
|---|---|---|---|
| 4× | 0.5× | 100.28 | +0.28% |
| 8× | 1.0× | 105.08 | +5.08% |
| 12× | 1.5× | 109.88 | +9.88% |
On a separate supply normalisation, a 4–5% deficit puts current demand at 104–105 against supply of 100. Following an assumed 10% subsequent supply increase, demand would need to grow approximately 4.8–5.8% to keep the market in balance. The middle demand case is close to that requirement.
The 10% supply increase is our sensitivity, not TrendForce's forecast. TrendForce sees possible rebalancing in calendar H2 2027. Supply outlook
Agent workloads already make persistent storage consequential
Published in February by researchers including DeepSeek-AI, the DualPath paper reports coding traces averaging 157 interaction rounds and 32.7k tokens of context, with only 429 appended tokens per round; that pattern implies a 98.7% KV-cache hit rate. Its workload analysis identifies loading cached context from persistent storage as a bottleneck, while the system improves online serving throughput by an average 1.96 times in its evaluation. DualPath, §§3 and 6
Agents repeatedly revisit their working context. Keeping it on SSD avoids recomputation and makes storage capacity and retrieval speed part of the cost of serving them.
Why architecture still matters
The ds4/DwarfStar repository and Apple's “LLM in a flash” demonstrate running models beyond available memory through SSD streaming. ds4, LLM in a flash
The larger commercial opportunity is enterprise deployment. NVIDIA's BlueField-4 and CMX programmes put flash between GPU memory and shared storage to retain and share inference state. BlueField-4, CMX
Kioxia’s product exposure
Kioxia’s CM10 line brings 332-layer BiCS10 to PCIe 6.0 models with capacities up to 61.44 TB. Against CM9, Kioxia claims approximately 92% higher sequential-read performance and 85% higher random-read performance. The drives were being sampled to selected customers, while the 2.5-inch version uses PCIe 5.0 and BiCS8.
CM9 context caching, CM10, GP1 GPU-direct storage and AiSAQ vector-search software sit within the FMS programme. GP1’s advertised demonstration reaches 10 million 512-byte random-read IOPS. CM10, FMS programme
BiCS10's claimed 59% density increase versus BiCS8 supports lower costs per bit, subject to yields and utilisation. BiCS10 announcement
These are product and sampling milestones, not yet booked revenue.
The supply collision
TrendForce sees possible NAND rebalancing in calendar H2 2027, while Micron’s June remarks project tight DRAM and NAND supply beyond calendar 2027. Kioxia’s July outlook also expects calendar-2027 NAND demand to exceed supply. The disagreement concerns how long pricing power lasts, which remains the key variable for March-2028 earnings. Company presentation, p. 5
Process migration and expansion at existing sites can add bits before new fabs come online, so the earnings risk arrives ahead of Kioxia’s Fab3 plan, which targets operations in the year ending March 2030, through higher density, better yields and selective expansion.
YMTC increases the competitive pressure. Counterpoint estimates its Q2 NAND bit share at 14%. Chinese domestic output can meet local demand and replace imports, forcing competing suppliers to place more bits in other markets. China accounted for approximately 16% of Kioxia’s last annual revenue.
6. The Next Catalysts
| Date | Event | What matters |
|---|---|---|
| 30 September | Micron results | Datacentre SSD sales, pricing and customer inventories |
| 30 September / 1 October | Kioxia split record / effective dates | Three-for-one share split |
| 6 November | Sandisk results | Customer agreements, SSD sales and shared-fab economics |
| 13 November | Kioxia results | September-quarter profit and the outlook for 2027 |
| Second half of 2027 | Potential NAND supply recovery | Whether new supply ends the pricing cycle |
Bloomberg provides the expected earnings dates; the company has confirmed the split dates.
The key distinction at the next results is an estimate miss versus deteriorating demand. The central model already assumes a 10% decline in dollar selling prices. Customer cancellations, materially weaker contract pricing or rising inventories would undermine that model; simply reporting below the Street would not.
7. The Yen, Shared Manufacturing and Policy
Quantifying the currency gap
September guidance is built around USDJPY 162. Using its Q2 volume assumptions, Kioxia reports ¥14 billion in quarterly revenue and ¥13 billion in quarterly operating profit per ¥1 exchange-rate move. July's rate had already been fixed when guidance was issued; August–September remained open. Company presentation, p. 15
| Change in USDJPY | Quarterly revenue effect | Quarterly operating-profit effect |
|---|---|---|
| Rises by ¥5: weaker yen | +¥70bn | +¥65bn |
| Falls by ¥5: stronger yen | −¥70bn | −¥65bn |
A stronger yen reduces reported profit, with the earnings effect set by exchange rates realised across the quarter rather than by the spot rate on a single day.
Manufacturing Investment
Government support remains a condition for Kioxia and Sandisk’s announced Japanese investment plan, which exceeds $31 billion, approximately ¥5 trillion, through 2032. Fab3 is separately scheduled to begin operations in the year ending March 2030. Joint investment plan, Fab3
The combined programme implies annual spending of ¥833.3 billion when the ¥5 trillion total is spread evenly across the assumed six-year 2027–2032 period.
| Illustrative allocation | Kioxia economic share assumption | Support assumption | Annual Kioxia-funded amount |
|---|---|---|---|
| Lower burden | 40% | 30% | ¥233.3bn |
| Central burden | 50% | 20% | ¥333.3bn |
| Higher burden | 60% | 0% | ¥500.0bn |
The allocation figures are assumptions; no corresponding funding commitments have been disclosed. The model must count each expenditure once:
Entity-level capex, partner contributions, leases, prepayments and wafer-purchase economics determine the overlap, while Sandisk’s annual filing documents its reliance on shared manufacturing. Sandisk annual filing
Trailing reported operating cash flow less cash capex was ¥1,142.045 billion, or 4.14% of the reconstructed equity value. Deducting hypothetical incremental investment of ¥333.3 billion or ¥500 billion reduces that ratio to 2.93% or 2.33%. These are stresses on historical cash flow, distinct from the forward cash scenarios. The bear scenario's similar ¥1,142.127 billion result is coincidental; it is calculated from assumed cash conversion and investment, not copied from the trailing figure.
Policy support helps finance the asset base and can also finance the additional supply that eventually compresses NAND margins.
Tariffs
The 14 January US proclamation imposed a 25% duty on a defined subset of advanced computing products. Its use-based exclusions include qualifying US datacentre uses, leaving NAND exposure dependent on product classification, end use and origin. Proclamation
8. Implementation
TradeXYZ's xyz:KIOXIA and xyz:JP225 perpetuals offer an alternative to the proposed spot implementation. Their projected and settled funding is in Appendix B; those figures are not financing or borrow-cost estimates for the spot position.
9. The Hedge and Downside Risk
Why the Short Is Larger Than the Long
The proposed hedge carries $2.83 of Nikkei exposure for every $1 long Kioxia. Kioxia has traded with substantially greater volatility than the index: across 27 weekly observations from March to September, a regression estimated a 3.53% Kioxia move for each 1% move in the Nikkei.
On that historical relationship, you would need roughly a 10.6% Nikkei short to hedge a 3% Kioxia long fully. At 8.5%, the proposed short leaves residual Japanese-market exposure, and that relationship can change.
| March–September weekly returns | Result |
|---|---|
| Kioxia / Nikkei correlation | 0.751 |
| Kioxia annualized volatility | 114.2% |
| Nikkei annualized volatility | 24.3% |
| 3% long / 8.5% short: annualized volatility as % of capital | 2.32% |
The calculation uses cash-price returns and excludes funding.
Drawdown and joint-leg stress
| Stress | Long contribution at initial 3% | Additional short effect | Combined before funding and costs |
|---|---|---|---|
| Kioxia falls 55%; index unchanged | −1.65% | 0.00% | −1.65% |
| Repeat 64.7% Kioxia decline; index unchanged | −1.94% | 0.00% | −1.94% |
| Kioxia falls 64.7%; index rises 20% | −1.94% | −1.70% | −3.64% |
| Kioxia value falls to zero; index unchanged | −3.00% | 0.00% | −3.00% |
Kioxia's close fell from ¥108,700 on 22 June to ¥38,380 on 29 July, a 64.69% decline.
If Kioxia falls while Japanese equities rise, the long and short legs can both lose. The memory-sector positions retain common supply-cycle exposure even after index beta is hedged.
Appendix A. Financial and Scenario Reconciliation
A1. Consensus EPS and net income
| Fiscal year ending | Consensus net income, ¥bn | Consensus EPS, ¥ | NI / EPS implied shares, million | EPS × 532.505007m filed net shares, ¥bn |
|---|---|---|---|---|
| Mar-27 | 5,605.3 | 10,411.65 | 538.37 | 5,544.3 |
| Mar-28 | 7,736.5 | 14,703.73 | 526.16 | 7,829.8 |
| Mar-29 | 8,749.5 | 17,305.35 | 505.59 | 9,215.2 |
Consensus EPS and net income aggregate contributors with differing adjustments and share assumptions. NI/EPS is a diagnostic ratio, not a reported share count.
Consensus price sensitivities use the EPS series. The independent operating model instead uses 70% of modelled EBIT and a fixed 532.505007 million-share denominator after excluding the filed treasury shares. This is a forward scenario assumption, not a replacement for historical weighted-average shares.
A2. Pair-return arithmetic
At fixed initial notionals:
where F is funding cash flow per unit of portfolio capital and E is execution cost.
A3. Operating-Model Calculations
The starting revenue is ¥10,084.2 billion and EBIT is ¥7,993.8 billion. The implied operating costs are:
The explicit modelling assumptions are:
- Allocate 75% of this cost base to variable costs and 25% to fixed costs.
- Scale variable costs with bits shipped and the change in cost per bit.
- Hold fixed yen costs constant.
- Treat revenue as dollar-linked and costs as yen-denominated for the currency sensitivity.
- Use USDJPY 162 as the normalisation rate.
- Convert EBIT to net income at 70%, close to the consensus net-income/EBIT ratio for the year ending March 2027.
- Hold shares at 532.505007 million: 548.639034 million issued less 16.134027 million treasury at 31 August. This incorporates the completed August buyback and assumes no subsequent net issuance or repurchases.
Thus:
where B is the shipment factor, P the realised-price factor and K the variable cost-per-bit factor.
Appendix B. Perpetual Funding Forecasts and Methodology
Funding for the Perpetual Alternative
The following forecasts apply only if we use the perpetuals. They are not financing or borrow-cost estimates for the spot long/short position.
Between 25 June and 15 September, 1,991 settlements comprised 782 negative and 1,209 positive exchange funding rates. With notional held constant, the long side incurred a cumulative funding cost of 10.30%.
The established model forecasts each leg from that settlement history; a positive figure below means the named position receives funding.
| Position | T+1d projected APR | T+7d projected APR | Method |
|---|---|---|---|
| Long xyz:KIOXIA | −17.78% | −8.67% | One-day ridge; seven-/thirty-day blend for seven days |
| Short xyz:JP225 | +4.03% | −4.08% | Same horizon rules; short-side sign |
| 3% long / 8.5% short, per unit capital | −0.191% | −0.607% | Notional-weighted cash flows |
At the full weights, the seven-day forecast implies a cost of 0.0116% of capital over seven days. Extending that rate unchanged to 59 days costs 0.0981%; that is a scenario, not a 59-day forecast.
Settled funding diagnostics
| Named position | Last 24h cash flow / notional | Last 7d cash flow / notional | Last 7d simple annualized |
|---|---|---|---|
| Kioxia long | +0.0304% | −0.1409% | −7.35% |
| JP225 short | −0.0036% | −0.1405% | −7.33% |
These are settled historical rates, not the forward funding estimates.
Forecast Method
The forecasts retain the horizon-specific methodology established for the CXMT funding trade.
Inputs and signs
Use each contract’s observed hourly funding rates:
- Align observations to UTC hours.
- Deduplicate observations.
- Reindex the hourly series so missing observations remain visible.
- Calculate trailing means over 24, 72, 168, 336 and 720 hours, requiring complete windows.
Internally, positive exchange funding means the long pays. Published position cash flows reverse that sign for a long and retain it for a short.
For forecast mean hourly exchange funding \hat f:
Seven-day forecast
Use an equal-weight blend of the complete trailing seven-day and thirty-day hourly means:
When the thirty-day window is incomplete but the seven-day window is complete, the short-history fallback uses the trailing seven-day mean.
Both contracts have complete thirty-day inputs at the cutoff.
One-day forecast
Use the per-contract ridge model on the five trailing means once at least 45 daily observations have complete features and realised subsequent 24-hour outcomes. Retain the established ridge penalty of 10.
Before that threshold, use:
At the cutoff, Kioxia has 52 complete training-day outcomes and JP225 has 90; both use the ridge forecast. The penalty belongs to the established model’s feature scaling and must be retained with that calibration rather than reapplied after changing rate units.
Model selection compared standalone windows from one to thirty days and coarse blends on matched dates, equal-weighting 22 eligible contracts.
Portfolio cash flow
For the proposed weights:
Equivalently:
Convert an APR into an H-hour cash-flow estimate by multiplying by H/8{,}760, at constant notional before execution costs.
Refresh the forecasts daily.
Appendix C. Sources and Data Provenance
Financial and market snapshots are dated 15 September 2026. The venue order book was observed at 22:16 UTC; funding inputs run through 23:00 UTC. Future report dates are Bloomberg expectations unless identified as company-confirmed.
Financials, markets and corporate actions
- Bloomberg: closing prices, reported financials, BEst consensus with explicit fiscal-year overrides, analyst recommendations, targets, bond quotes, expected report dates and volume snapshots. Kioxia/Nikkei charts use daily BEST_PE_RATIO and BEST_EPS with BEST_FPERIOD_OVERRIDE=1BF on 172 common trading sessions, 5 January–15 September 2026. Fiscal-year valuation rows use 1FY and 2FY. Gross-margin forecasts and annual EPS/EBITDA were retrieved on 16 September.
- Hyperliquid public venue data: hourly funding settlements and contract metadata.
- Kioxia June-quarter results, 31 July: IFRS and non-GAAP results, guidance, balance sheet and cash flows.
- Kioxia June-2026 quarter presentation, 31 July; mirrored PDF: demand outlook, ASPs, segment mix, quarterly FX sensitivity and calendar-2028 LTA target (pp. 5, 9, 10, 15 and 17).
- Annual securities report, year ended March 2026: customer and geographic concentration.
- Split notice, buyback completion, shareholder change, Prime compliance.
- Nikkei inclusion, US-listing clarification, IR calendar.
Industry demand, pricing and technology
- Kioxia Investor Day, 2 June: TechInsights-sourced total-flash, datacentre and inference demand forecasts, slide 15.
- Sandisk Investor Day, 13 August: customer agreements, financial targets and enterprise-flash market forecast.
-
DualPath research paper: measured agent-workload reuse, storage bottlenecks and serving-throughput evaluation.
-
Counterpoint NAND tracker: enterprise SSD and YMTC bit shares.
- TrendForce Q3 pricing forecast, supply outlook, enterprise SSD revenue estimate.
- Sandisk Q4/FY2026 results, Micron Q3 prepared remarks.
- DeepSeek V4.1 Flash, ds4 source, LLM in a flash.
- NVIDIA BlueField-4, CMX technical explanation.
- Kioxia CM10, FMS demonstrations, BiCS10.
Investment and policy
- Kioxia–Sandisk joint investment plan, Fab3 plan.
- Sandisk annual filing: shared-manufacturing structure and obligations.
- January semiconductor tariff proclamation.
Corbanu · Trade note · 15 September 2026