 Corbanu
SK hynix versus QQQ and commodity producers: complete Bloomberg comparison
Captured 22 September 2026, 01:01 UTC via the existing Bloomberg Desktop bridge. Holdings and rounded allocations were supplied by the user as of 18 September 2026. This is a comparison of that supplied universe; Bloomberg FUND_HOLDINGS and INDX_MEMBERS probes on QQQ returned no rows and are not represented as validation of the fund composition.
Return to article · Full 101-security CSV with weights and raw fields · Full Bloomberg panel · Request metadata · Calculation source
Definitions and coverage
- P/E: Bloomberg BEST_PE_RATIO, BEST_FPERIOD_OVERRIDE=1BF. Positive observations only for P/E averages. Nonpositive/missing P/E is n/a, never zero. No winsorization or outlier removal.
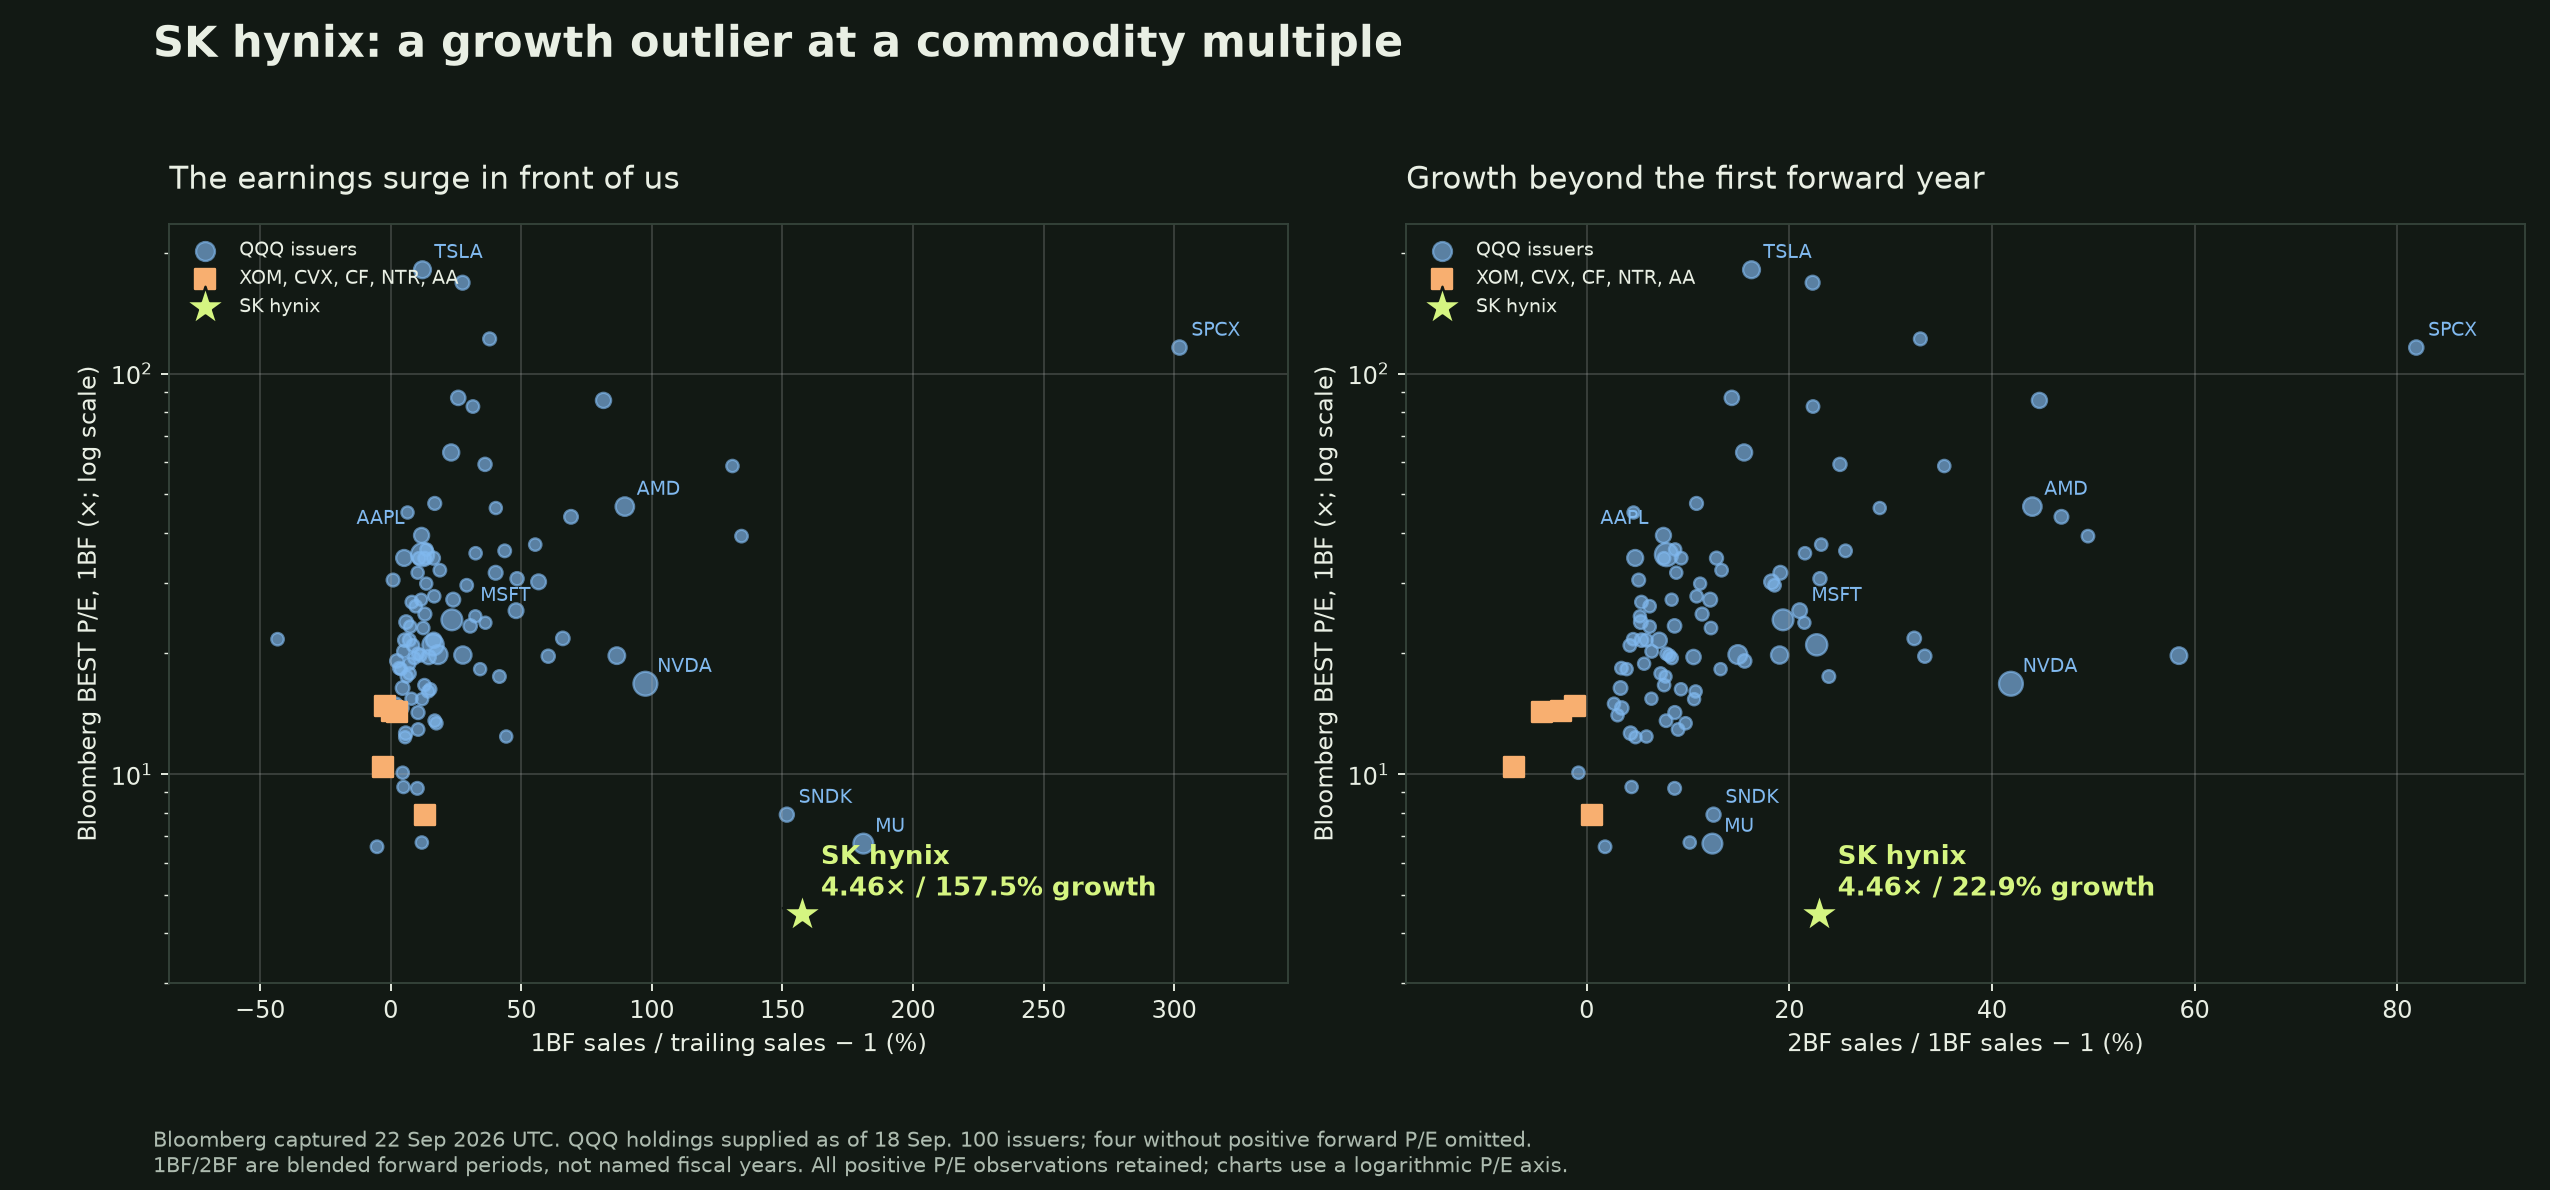
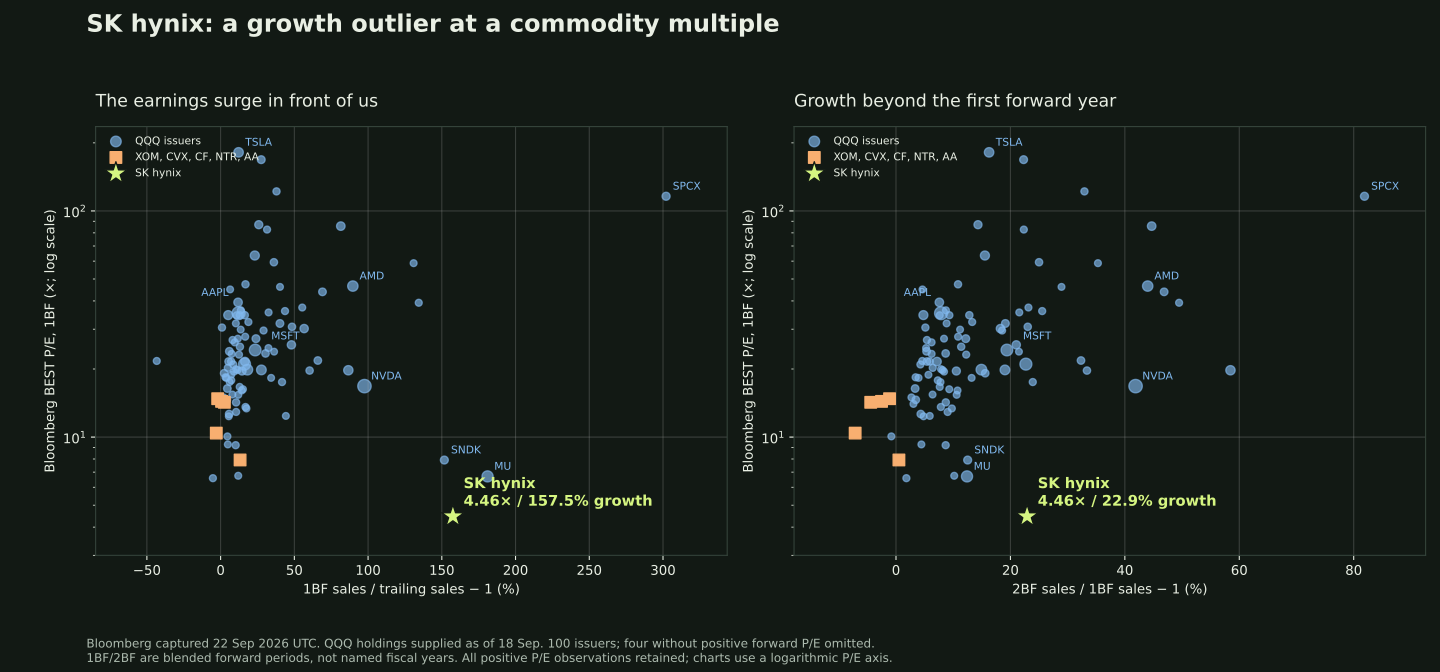
- First growth measure: 100 × (BEST_SALES 1BF / TRAIL_12M_NET_SALES − 1). The numerator and denominator are total company sales in the same reporting currency and Bloomberg units.
- Second growth measure: 100 × (BEST_SALES 2BF / BEST_SALES 1BF − 1). 1BF and 2BF are blended forward periods; fiscal-year endpoints vary by issuer.
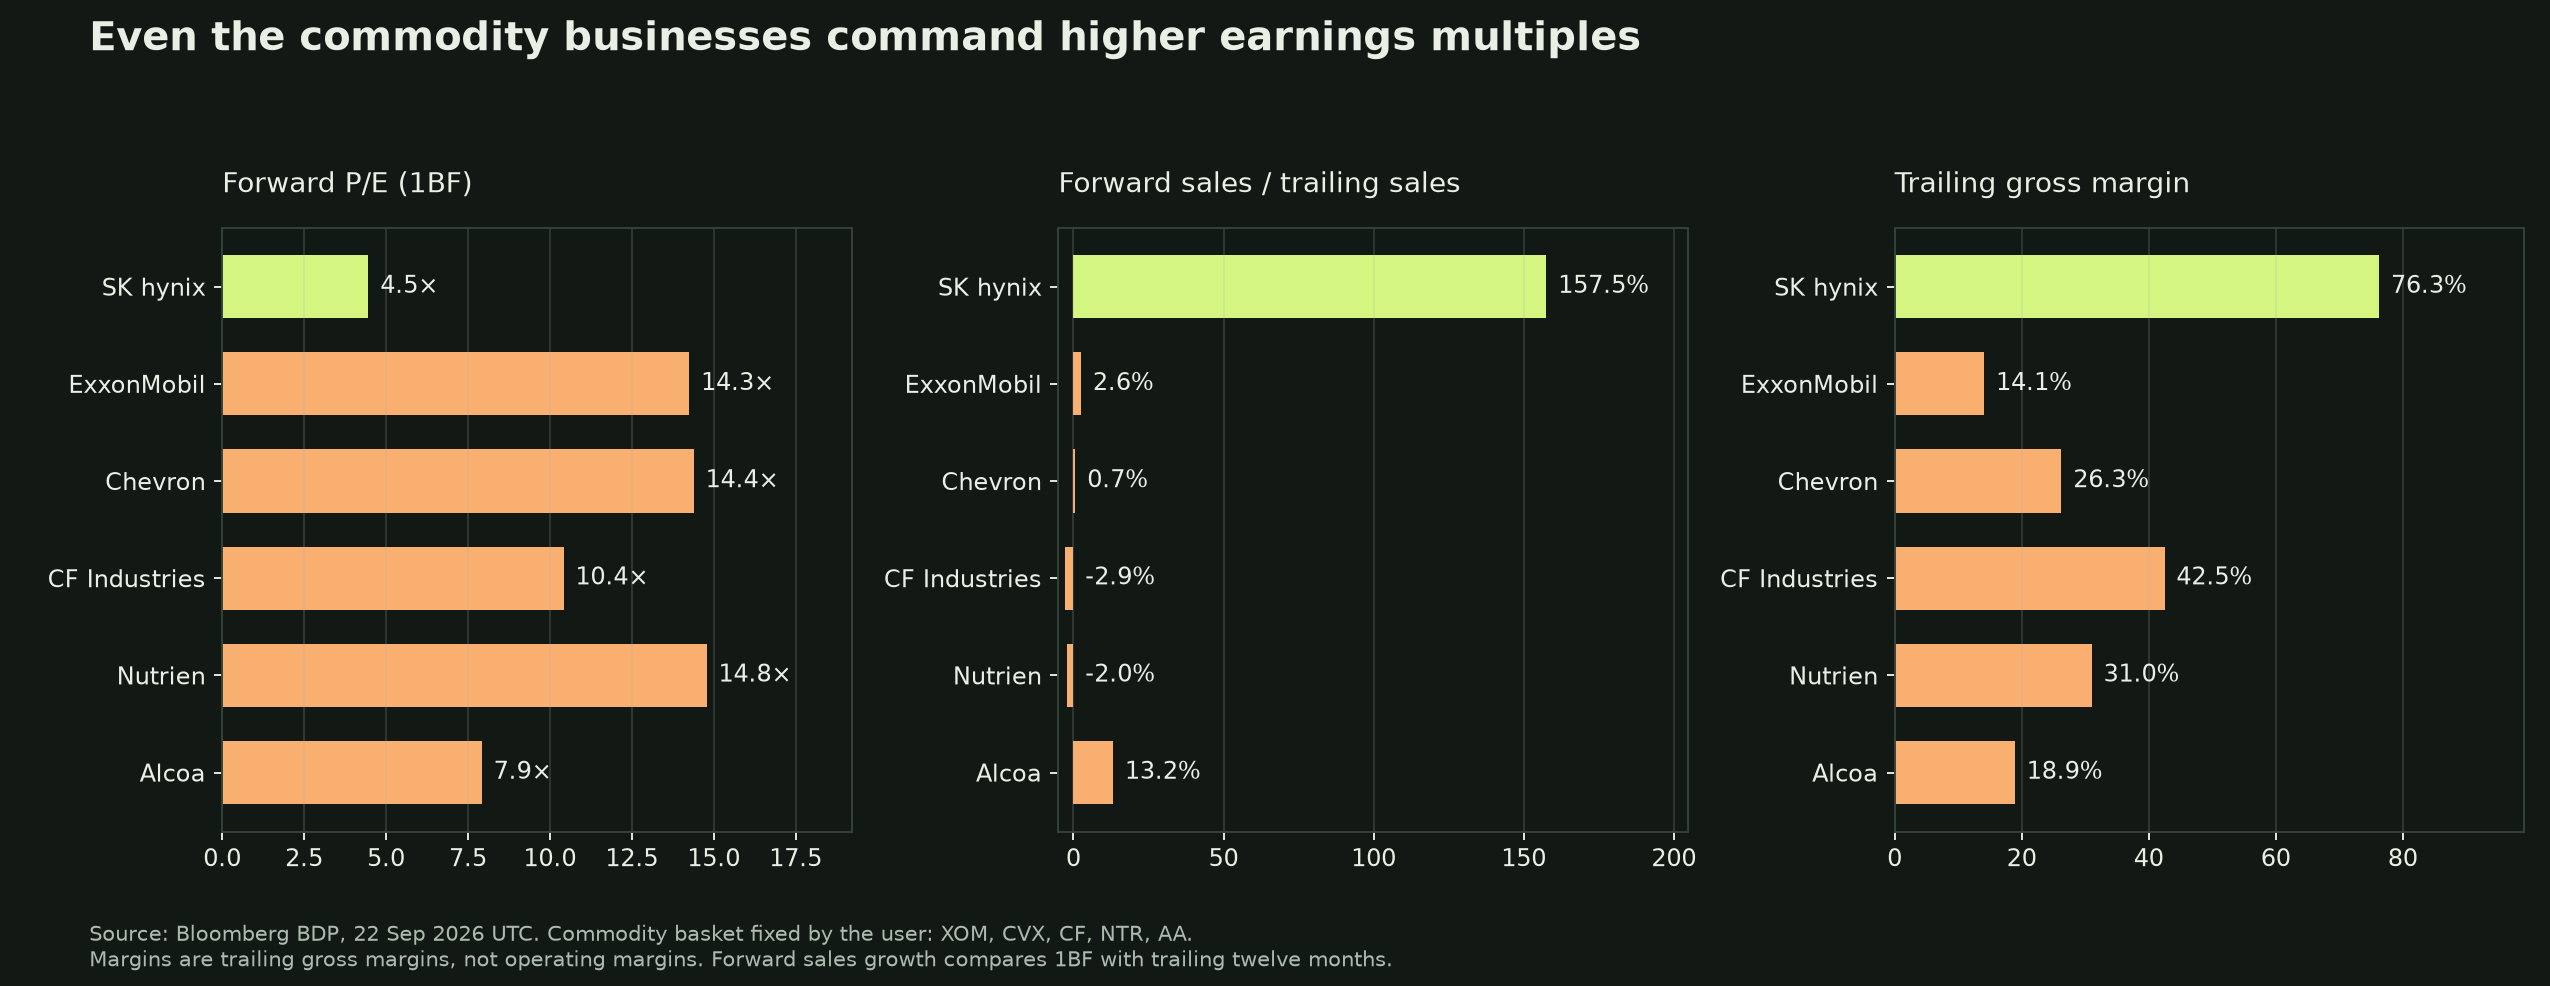
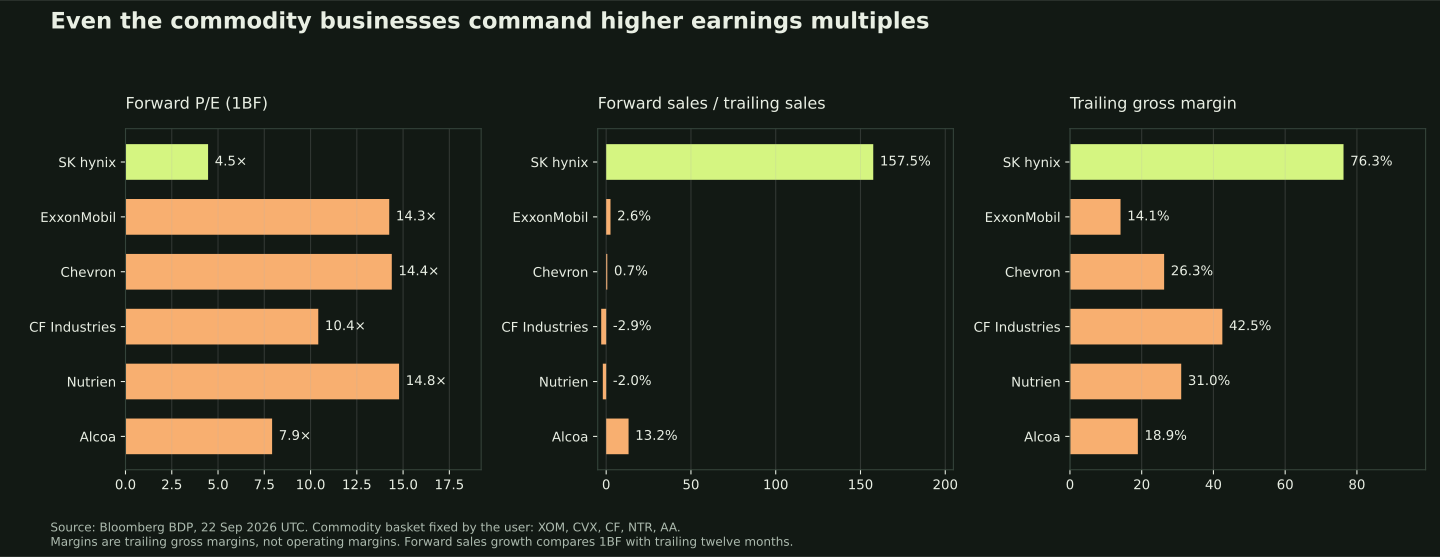
- Trailing gross margin: TRAIL_12M_GROSS_MARGIN. Forward gross margin: BEST_GROSS_MARGIN with 1BF. Values already in percentage units. No substitution of operating margins.
- The matched-currency PX_LAST / BEST_EPS arithmetic reproduces the direct P/E fields to better than 0.0001% relative error. For PDD, CCEP, FER and ASML, trading and earnings currencies differ; direct Bloomberg P/E handles that normalization, so an unconverted price/EPS quotient is not used.
- All 101 company share-class rows resolved to Bloomberg names. They represent 100 issuers and 99.82% of supplied portfolio weight. Alphabet classes are combined at issuer level, using Class A fundamentals/P/E and summed allocation. The two class-specific P/Es remain in the full table/CSV.
- The supplied table has 106 total rows. Non-company cash/futures/dividend rows are retained below and excluded from company multiples. Rounded supplied weights sum to 99.96%, not exactly 100%.
- Undefined positive forward P/E: CoreWeave, Nebius, Rocket Lab, Warner Bros. Discovery. They remain in revenue-growth calculations; no earnings multiple is imputed.
- “Technology” means Bloomberg GICS Information Technology: 42 issuers. Alphabet, Meta and other platforms in different sectors remain in all-QQQ averages and the selected-largest-issuers table.
- Equal-weight averages use one observation per issuer; counts accompany each metric. Weighted arithmetic means renormalize supplied weights over valid observations. Neither statistic is an ETF aggregate P/E or a market-cap-weighted earnings yield.
- Two exploratory bare-year override requests (2026/2027) returned missing EPS/P/E and identical quarterly-sized sales; these were rejected. Only explicit 1BF/2BF requests enter the displayed comparison.
Group means, medians and denominators
| Comparison group | Mean / median 1BF P/E | Mean sales growth: 1BF / trailing | Mean sales growth: 2BF / 1BF | Mean trailing gross margin |
|---|---|---|---|---|
| SK hynix | 4.46× | 157.5% | 22.9% | 76.3% |
| QQQ all issuers | 31.6× / 22.5× (96/100) | 37.4% (100/100) | 16.5% (100/100) | 57.5% (96/100) |
| QQQ Information Technology | 37.8× / 26.4× (40/42) | 64.3% (42/42) | 24.6% (42/42) | 65.6% (42/42) |
| Five commodity producers | 12.4× / 14.3× (5/5) | 2.3% (5/5) | -2.9% (5/5) | 26.6% (5/5) |
Full summary, including weighted means and coverage: summary.json.
All technology holdings
| Company | BEST P/E (1BF) | Sales: 1BF / trailing | Sales: 2BF / 1BF | Gross margin, trailing | Gross margin, 1BF |
|---|---|---|---|---|---|
| NVIDIA Corp (NVDA) | 16.8× | 97.6% | 41.9% | 74.7% | 73.1% |
| Apple Inc (AAPL) | 35.3× | 12.2% | 7.9% | 48.7% | 47.5% |
| Microsoft Corp (MSFT) | 24.3× | 23.4% | 19.4% | 67.9% | 65.9% |
| Micron Technology Inc (MU) | 6.7× | 181.0% | 12.4% | 72.6% | 85.9% |
| Advanced Micro Devices Inc (AMD) | 46.5× | 89.7% | 44.0% | 53.2% | 55.6% |
| Broadcom Inc (AVGO) | 19.8× | 86.6% | 58.5% | 68.8% | 72.1% |
| Intel Corp (INTC) | 63.5× | 23.2% | 15.5% | 38.6% | 43.4% |
| Cisco Systems Inc (CSCO) | 21.6× | 16.5% | 7.2% | 64.5% | 64.8% |
| Palantir Technologies Inc (PLTR) | 85.7× | 81.5% | 44.7% | 84.8% | 86.3% |
| Lam Research Corp (LRCX) | 30.2× | 56.6% | 18.3% | 50.5% | 52.0% |
| Applied Materials Inc (AMAT) | 25.6× | 48.0% | 21.0% | 49.4% | 50.7% |
| Palo Alto Networks Inc (PANW) | 86.9× | 25.9% | 14.3% | 70.4% | 75.4% |
| Sandisk Corp (SNDK) | 7.9× | 151.7% | 12.5% | 71.5% | 84.2% |
| Texas Instruments Inc (TXN) | 27.2× | 24.0% | 12.2% | 58.3% | 61.6% |
| Crowdstrike Holdings Inc (CRWD) | 168.6× | 27.5% | 22.3% | 75.2% | 79.0% |
| KLA Corp (KLAC) | 31.8× | 40.2% | 19.1% | 61.3% | 62.7% |
| Marvell Technology Inc (MRVL) | 43.9× | 69.1% | 46.9% | 52.2% | 58.0% |
| Seagate Technology Holdings PLC (STX) | 21.8× | 65.9% | 32.3% | 45.6% | 61.1% |
| QUALCOMM Inc (QCOM) | 19.2× | 2.4% | 15.6% | 54.2% | 52.8% |
| Analog Devices Inc (ADI) | 23.4× | 30.5% | 8.7% | 65.8% | 73.9% |
| Shopify Inc (SHOP) | 59.3× | 36.1% | 25.0% | 47.8% | 47.0% |
| ASML Holding NV (ASML) | 30.7× | 48.4% | 23.0% | 52.7% | 55.9% |
| Western Digital Corp (WDC) | 19.7× | 60.3% | 33.4% | 48.9% | 60.1% |
| Fortinet Inc (FTNT) | 47.4× | 16.9% | 10.8% | 80.2% | 80.2% |
| ARM Holdings PLC (ARM) | 122.0× | 37.9% | 32.9% | 97.5% | 94.3% |
| Adobe Inc (ADBE) | 9.2× | 10.2% | 8.7% | 89.3% | 89.4% |
| Intuit Inc (INTU) | 12.9× | 10.5% | 9.0% | 80.2% | 81.4% |
| Cadence Design Systems Inc (CDNS) | 32.3× | 18.8% | 13.3% | 85.9% | 87.9% |
| Datadog Inc (DDOG) | 82.7× | 31.5% | 22.3% | 79.5% | 80.3% |
| Synopsys Inc (SNPS) | 23.2× | 12.5% | 12.3% | 72.4% | 83.5% |
| Lumentum Holdings Inc (LITE) | 39.3× | 134.4% | 49.5% | 41.7% | 52.0% |
| Monolithic Power Systems Inc (MPWR) | 37.4× | 55.4% | 23.2% | 55.2% | 55.9% |
| Teradyne Inc (TER) | 35.6× | 32.5% | 21.5% | 59.2% | 59.5% |
| NXP Semiconductors NV (NXPI) | 13.4× | 17.5% | 9.8% | 56.0% | 59.2% |
| Astera Labs Inc (ALAB) | 58.8× | 130.9% | 35.3% | 75.1% | 71.4% |
| Strategy Inc (MSTR) | 15.0× | 2.0% | 2.7% | 67.6% | 66.1% |
| Nebius Group NV (NBIS) | n/a | 621.8% | 119.3% | 74.3% | 74.1% |
| Autodesk Inc (ADSK) | 16.1× | 14.4% | 10.8% | 91.2% | 92.9% |
| Microchip Technology Inc (MCHP) | 18.3× | 34.3% | 13.2% | 60.2% | 66.1% |
| Workday Inc (WDAY) | 15.4× | 12.0% | 10.6% | 75.8% | 79.5% |
| Roper Technologies Inc (ROP) | 15.4× | 8.0% | 6.4% | 69.5% | 69.9% |
| CoreWeave Inc (CRWV) | n/a | 201.0% | 67.4% | 67.4% | 69.8% |
Commodity businesses: full requested group
| Company | BEST P/E (1BF) | Sales: 1BF / trailing | Sales: 2BF / 1BF | Gross margin, trailing | Gross margin, 1BF |
|---|---|---|---|---|---|
| SK hynix (000660) | 4.5× | 157.5% | 22.9% | 76.3% | 84.3% |
| ExxonMobil (XOM) | 14.3× | 2.6% | -4.4% | 14.1% | n/a |
| Chevron (CVX) | 14.4× | 0.7% | -2.5% | 26.3% | n/a |
| CF Industries (CF) | 10.4× | -2.9% | -7.1% | 42.5% | 40.9% |
| Nutrien (NTR) | 14.8× | -2.0% | -1.1% | 31.0% | 31.2% |
| Alcoa (AA) | 7.9× | 13.2% | 0.5% | 18.9% | 18.8% |
All QQQ company holdings
Order follows the supplied list; Alphabet's two share classes both appear here. Download the CSV above for allocations, GICS classifications, observation-date fields and raw values.
| Company | BEST P/E (1BF) | Sales: 1BF / trailing | Sales: 2BF / 1BF | Gross margin, trailing | Gross margin, 1BF |
|---|---|---|---|---|---|
| NVIDIA Corp (NVDA) | 16.8× | 97.6% | 41.9% | 74.7% | 73.1% |
| Apple Inc (AAPL) | 35.3× | 12.2% | 7.9% | 48.7% | 47.5% |
| Microsoft Corp (MSFT) | 24.3× | 23.4% | 19.4% | 67.9% | 65.9% |
| Micron Technology Inc (MU) | 6.7× | 181.0% | 12.4% | 72.6% | 85.9% |
| Amazon.com Inc (AMZN) | 19.9× | 18.1% | 14.9% | 50.8% | 52.6% |
| Advanced Micro Devices Inc (AMD) | 46.5× | 89.7% | 44.0% | 53.2% | 55.6% |
| Alphabet Inc Class A (GOOGL) | 21.0× | 16.2% | 22.7% | 60.9% | 67.5% |
| Meta Platforms Inc (META) | 19.8× | 27.7% | 19.0% | 81.7% | 79.6% |
| Alphabet Inc Class C (GOOG) | 20.8× | 16.2% | 22.7% | 60.9% | 67.5% |
| Tesla Inc (TSLA) | 181.6× | 12.2% | 16.3% | 18.9% | 19.1% |
| Broadcom Inc (AVGO) | 19.8× | 86.6% | 58.5% | 68.8% | 72.1% |
| Intel Corp (INTC) | 63.5× | 23.2% | 15.5% | 38.6% | 43.4% |
| Walmart Inc (WMT) | 34.6× | 5.2% | 4.8% | 25.2% | 24.6% |
| Cisco Systems Inc (CSCO) | 21.6× | 16.5% | 7.2% | 64.5% | 64.8% |
| Palantir Technologies Inc (PLTR) | 85.7× | 81.5% | 44.7% | 84.8% | 86.3% |
| Costco Wholesale Corp (COST) | 39.4× | 11.8% | 7.6% | 12.9% | 11.4% |
| Lam Research Corp (LRCX) | 30.2× | 56.6% | 18.3% | 50.5% | 52.0% |
| Applied Materials Inc (AMAT) | 25.6× | 48.0% | 21.0% | 49.4% | 50.7% |
| Netflix Inc (NFLX) | 19.6× | 14.5% | 10.5% | 49.1% | 51.6% |
| Palo Alto Networks Inc (PANW) | 86.9× | 25.9% | 14.3% | 70.4% | 75.4% |
| Space Exploration Technologies Corp (SPCX) | 116.1× | 302.1% | 81.9% | 49.4% | 59.7% |
| Sandisk Corp (SNDK) | 7.9× | 151.7% | 12.5% | 71.5% | 84.2% |
| Texas Instruments Inc (TXN) | 27.2× | 24.0% | 12.2% | 58.3% | 61.6% |
| Crowdstrike Holdings Inc (CRWD) | 168.6× | 27.5% | 22.3% | 75.2% | 79.0% |
| KLA Corp (KLAC) | 31.8× | 40.2% | 19.1% | 61.3% | 62.7% |
| Marvell Technology Inc (MRVL) | 43.9× | 69.1% | 46.9% | 52.2% | 58.0% |
| Linde PLC (LIN) | 23.9× | 5.9% | 5.3% | 48.3% | 49.0% |
| Amgen Inc (AMGN) | 16.4× | 4.6% | 3.3% | 69.5% | 81.5% |
| Seagate Technology Holdings PLC (STX) | 21.8× | 65.9% | 32.3% | 45.6% | 61.1% |
| QUALCOMM Inc (QCOM) | 19.2× | 2.4% | 15.6% | 54.2% | 52.8% |
| Gilead Sciences Inc (GILD) | 21.6× | 5.4% | 5.4% | 79.6% | 86.8% |
| Analog Devices Inc (ADI) | 23.4× | 30.5% | 8.7% | 65.8% | 73.9% |
| T-Mobile US Inc (TMUS) | 12.6× | 5.8% | 4.3% | 62.2% | 63.4% |
| PepsiCo Inc (PEP) | 14.6× | 4.3% | 3.5% | 54.0% | 54.2% |
| Shopify Inc (SHOP) | 59.3× | 36.1% | 25.0% | 47.8% | 47.0% |
| ASML Holding NV (ASML) | 30.7× | 48.4% | 23.0% | 52.7% | 55.9% |
| Western Digital Corp (WDC) | 19.7× | 60.3% | 33.4% | 48.9% | 60.1% |
| Intuitive Surgical Inc (ISRG) | 34.6× | 16.4% | 12.8% | 66.7% | 68.4% |
| Booking Holdings Inc (BKNG) | 14.2× | 10.5% | 8.7% | n/a | 100.0% |
| Vertex Pharmaceuticals Inc (VRTX) | 25.1× | 13.1% | 11.4% | 86.0% | 86.8% |
| Fortinet Inc (FTNT) | 47.4× | 16.9% | 10.8% | 80.2% | 80.2% |
| ARM Holdings PLC (ARM) | 122.0× | 37.9% | 32.9% | 97.5% | 94.3% |
| Starbucks Corp (SBUX) | 30.5× | 0.9% | 5.1% | 22.1% | 67.9% |
| Automatic Data Processing Inc (ADP) | 21.6× | 7.1% | 5.9% | 46.4% | 46.8% |
| Adobe Inc (ADBE) | 9.2× | 10.2% | 8.7% | 89.3% | 89.4% |
| AppLovin Corp (APP) | 17.5× | 41.6% | 23.9% | 88.5% | 87.8% |
| Constellation Energy Corp (CEG) | 20.2× | 4.9% | 6.4% | 43.9% | 48.0% |
| MercadoLibre Inc (MELI) | 36.1× | 43.7% | 25.6% | 42.7% | 42.1% |
| Marriott International Inc/MD (MAR) | 26.9× | 8.1% | 5.4% | 20.2% | 56.1% |
| CSX Corp (CSX) | 20.9× | 8.5% | 4.3% | n/a | 38.1% |
| Monster Beverage Corp (MNST) | 34.6× | 13.0% | 9.3% | 55.5% | 55.8% |
| Intuit Inc (INTU) | 12.9× | 10.5% | 9.0% | 80.2% | 81.4% |
| Comcast Corp (CMCSA) | 6.6× | -5.2% | 1.8% | 69.4% | 53.0% |
| Regeneron Pharmaceuticals Inc (REGN) | 13.6× | 16.9% | 7.8% | 84.9% | 84.9% |
| DoorDash Inc (DASH) | 29.6× | 29.1% | 18.5% | 51.4% | 53.1% |
| Cintas Corp (CTAS) | 34.6× | 10.9% | 7.6% | 50.7% | 51.1% |
| Mondelez International Inc (MDLZ) | 18.4× | 3.3% | 3.4% | 31.1% | 34.4% |
| Cadence Design Systems Inc (CDNS) | 32.3× | 18.8% | 13.3% | 85.9% | 87.9% |
| Datadog Inc (DDOG) | 82.7× | 31.5% | 22.3% | 79.5% | 80.3% |
| Synopsys Inc (SNPS) | 23.2× | 12.5% | 12.3% | 72.4% | 83.5% |
| Ross Stores Inc (ROST) | 26.2× | 9.6% | 6.2% | 29.7% | 29.1% |
| Lumentum Holdings Inc (LITE) | 39.3× | 134.4% | 49.5% | 41.7% | 52.0% |
| O'Reilly Automotive Inc (ORLY) | 23.3× | 7.5% | 6.2% | 51.6% | 51.9% |
| Warner Bros Discovery Inc (WBD) | n/a | 2.3% | 2.2% | 47.2% | n/a |
| Airbnb Inc (ABNB) | 27.8× | 16.7% | 10.9% | 82.9% | 83.2% |
| Honeywell International Inc (HON) | 21.7× | -43.3% | 4.6% | 36.6% | 41.7% |
| American Electric Power Co Inc (AEP) | 17.8× | 7.2% | 7.3% | 67.7% | 71.4% |
| PACCAR Inc (PCAR) | 16.7× | 12.9% | 7.6% | 16.6% | 15.5% |
| Monolithic Power Systems Inc (MPWR) | 37.4× | 55.4% | 23.2% | 55.2% | 55.9% |
| Teradyne Inc (TER) | 35.6× | 32.5% | 21.5% | 59.2% | 59.5% |
| NXP Semiconductors NV (NXPI) | 13.4× | 17.5% | 9.8% | 56.0% | 59.2% |
| Baker Hughes Co (BKR) | 20.0× | 10.5% | 7.9% | 23.6% | 23.5% |
| Fastenal Co (FAST) | 36.4× | 13.7% | 8.7% | 44.7% | 44.3% |
| Diamondback Energy Inc (FANG) | 10.1× | 4.6% | -0.8% | 37.9% | 79.8% |
| PDD Holdings Inc (PDD) | 6.7× | 11.9% | 10.2% | 56.3% | 56.6% |
| Astera Labs Inc (ALAB) | 58.8× | 130.9% | 35.3% | 75.1% | 71.4% |
| Honeywell Aerospace Inc (HONA) | 19.8× | 11.4% | 8.2% | 34.8% | 39.5% |
| Strategy Inc (MSTR) | 15.0× | 2.0% | 2.7% | 67.6% | 66.1% |
| Nebius Group NV (NBIS) | n/a | 621.8% | 119.3% | 74.3% | 74.1% |
| PayPal Holdings Inc (PYPL) | 9.3× | 4.9% | 4.4% | 50.6% | 44.1% |
| Autodesk Inc (ADSK) | 16.1× | 14.4% | 10.8% | 91.2% | 92.9% |
| Xcel Energy Inc (XEL) | 16.3× | 15.2% | 9.3% | 67.6% | 67.9% |
| Coca-Cola Europacific Partners PLC (CCEP) | 18.3× | 4.0% | 3.9% | 35.6% | 35.6% |
| Exelon Corp (EXC) | 14.0× | 2.6% | 3.0% | 63.5% | 64.7% |
| Keurig Dr Pepper Inc (KDP) | 12.4× | 44.3% | 5.9% | 49.4% | 47.4% |
| Paychex Inc (PAYX) | 18.9× | 7.2% | 5.7% | 74.3% | 74.9% |
| IDEXX Laboratories Inc (IDXX) | 31.8× | 10.3% | 8.8% | 62.4% | 63.2% |
| Microchip Technology Inc (MCHP) | 18.3× | 34.3% | 13.2% | 60.2% | 66.1% |
| Ferrovial NV (FER) | 45.0× | 6.5% | 4.6% | n/a | n/a |
| Workday Inc (WDAY) | 15.4× | 12.0% | 10.6% | 75.8% | 79.5% |
| Take-Two Interactive Software Inc (TTWO) | 24.8× | 32.4% | 5.3% | 56.0% | 64.9% |
| Roper Technologies Inc (ROP) | 15.4× | 8.0% | 6.4% | 69.5% | 69.9% |
| Rocket Lab Corp (RKLB) | n/a | 66.2% | 35.5% | 37.3% | 38.6% |
| CoreWeave Inc (CRWV) | n/a | 201.0% | 67.4% | 67.4% | 69.8% |
| Axon Enterprise Inc (AXON) | 46.1× | 40.3% | 28.9% | 59.4% | 62.1% |
| Old Dominion Freight Line Inc (ODFL) | 27.2× | 11.7% | 8.4% | 33.6% | 75.9% |
| Thomson Reuters Corp (TRI) | 19.5× | 9.1% | 8.4% | n/a | 40.6% |
| Dexcom Inc (DXCM) | 29.9× | 13.6% | 11.2% | 62.5% | 64.6% |
| Alnylam Pharmaceuticals Inc (ALNY) | 23.9× | 36.3% | 21.5% | 79.7% | 76.6% |
| GE HealthCare Technologies Inc (GEHC) | 12.4× | 5.5% | 4.8% | 39.5% | 40.6% |
| Copart Inc (CPRT) | 17.5× | 6.1% | 7.8% | 44.7% | 44.6% |
Supplied holdings ledger, including non-company rows
| Name | Allocation % | Mapped ticker / exclusion |
|---|---|---|
| NVIDIA Corp | 8.54 | NVDA |
| Apple Inc | 7.82 | AAPL |
| Microsoft Corp | 5.81 | MSFT |
| Micron Technology Inc | 5.01 | MU |
| Amazon.com Inc | 4.33 | AMZN |
| Advanced Micro Devices Inc | 3.99 | AMD |
| Alphabet Inc Class A | 3.23 | GOOGL |
| Meta Platforms Inc | 3.12 | META |
| Alphabet Inc Class C | 2.98 | GOOG |
| Tesla Inc | 2.88 | TSLA |
| Broadcom Inc | 2.69 | AVGO |
| Intel Corp | 2.39 | INTC |
| Walmart Inc | 2.28 | WMT |
| Cisco Systems Inc | 1.89 | CSCO |
| Palantir Technologies Inc | 1.78 | PLTR |
| Costco Wholesale Corp | 1.74 | COST |
| Lam Research Corp | 1.58 | LRCX |
| Applied Materials Inc | 1.54 | AMAT |
| Netflix Inc | 1.32 | NFLX |
| Palo Alto Networks Inc | 1.3 | PANW |
| Space Exploration Technologies Corp | 1.28 | SPCX |
| Sandisk Corp | 1.16 | SNDK |
| Texas Instruments Inc | 1.06 | TXN |
| Crowdstrike Holdings Inc | 1.06 | CRWD |
| KLA Corp | 1.01 | KLAC |
| Marvell Technology Inc | 0.93 | MRVL |
| Linde PLC | 0.93 | LIN |
| Amgen Inc | 0.91 | AMGN |
| Seagate Technology Holdings PLC | 0.84 | STX |
| QUALCOMM Inc | 0.82 | QCOM |
| Gilead Sciences Inc | 0.82 | GILD |
| Analog Devices Inc | 0.8 | ADI |
| T-Mobile US Inc | 0.8 | TMUS |
| PepsiCo Inc | 0.78 | PEP |
| Shopify Inc | 0.69 | SHOP |
| ASML Holding NV | 0.67 | ASML |
| Western Digital Corp | 0.67 | WDC |
| Intuitive Surgical Inc | 0.61 | ISRG |
| Booking Holdings Inc | 0.57 | BKNG |
| Vertex Pharmaceuticals Inc | 0.56 | VRTX |
| Fortinet Inc | 0.54 | FTNT |
| ARM Holdings PLC | 0.51 | ARM |
| Starbucks Corp | 0.48 | SBUX |
| Automatic Data Processing Inc | 0.48 | ADP |
| Adobe Inc | 0.44 | ADBE |
| AppLovin Corp | 0.41 | APP |
| Constellation Energy Corp | 0.4 | CEG |
| MercadoLibre Inc | 0.4 | MELI |
| Marriott International Inc/MD | 0.39 | MAR |
| CSX Corp | 0.38 | CSX |
| Monster Beverage Corp | 0.38 | MNST |
| Intuit Inc | 0.36 | INTU |
| Comcast Corp | 0.35 | CMCSA |
| Regeneron Pharmaceuticals Inc | 0.35 | REGN |
| DoorDash Inc | 0.35 | DASH |
| Cintas Corp | 0.35 | CTAS |
| Mondelez International Inc | 0.34 | MDLZ |
| Cadence Design Systems Inc | 0.34 | CDNS |
| Datadog Inc | 0.33 | DDOG |
| Synopsys Inc | 0.32 | SNPS |
| Ross Stores Inc | 0.32 | ROST |
| Lumentum Holdings Inc | 0.32 | LITE |
| O'Reilly Automotive Inc | 0.31 | ORLY |
| Warner Bros Discovery Inc | 0.3 | WBD |
| Airbnb Inc | 0.3 | ABNB |
| Honeywell International Inc | 0.29 | HON |
| American Electric Power Co Inc | 0.29 | AEP |
| PACCAR Inc | 0.27 | PCAR |
| Monolithic Power Systems Inc | 0.26 | MPWR |
| Teradyne Inc | 0.25 | TER |
| NXP Semiconductors NV | 0.25 | NXPI |
| Baker Hughes Co | 0.25 | BKR |
| Fastenal Co | 0.25 | FAST |
| Diamondback Energy Inc | 0.24 | FANG |
| PDD Holdings Inc | 0.23 | PDD |
| Astera Labs Inc | 0.23 | ALAB |
| Honeywell Aerospace Inc | 0.23 | HONA |
| Strategy Inc | 0.22 | MSTR |
| Nebius Group NV | 0.22 | NBIS |
| PayPal Holdings Inc | 0.2 | PYPL |
| Autodesk Inc | 0.2 | ADSK |
| Xcel Energy Inc | 0.2 | XEL |
| Coca-Cola Europacific Partners PLC | 0.19 | CCEP |
| Exelon Corp | 0.19 | EXC |
| Keurig Dr Pepper Inc | 0.18 | KDP |
| Paychex Inc | 0.18 | PAYX |
| IDEXX Laboratories Inc | 0.18 | IDXX |
| Microchip Technology Inc | 0.17 | MCHP |
| Ferrovial NV | 0.17 | FER |
| Workday Inc | 0.17 | WDAY |
| Take-Two Interactive Software Inc | 0.17 | TTWO |
| Roper Technologies Inc | 0.16 | ROP |
| Rocket Lab Corp | 0.16 | RKLB |
| CoreWeave Inc | 0.16 | CRWV |
| Axon Enterprise Inc | 0.16 | AXON |
| Old Dominion Freight Line Inc | 0.16 | ODFL |
| Thomson Reuters Corp | 0.16 | TRI |
| CME E-Mini NASDAQ 100 Index Future | 0.15 | Non-company row; no company P/E |
| Dexcom Inc | 0.15 | DXCM |
| Alnylam Pharmaceuticals Inc | 0.14 | ALNY |
| CASH & EQUIVALENTS | 0.13 | Non-company row; no company P/E |
| GE HealthCare Technologies Inc | 0.13 | GEHC |
| Copart Inc | 0.12 | CPRT |
| CASH COLLATERAL | 0.01 | Non-company row; no company P/E |
| CONTRA FUTURE NASDAQ 100 E-MINI DEC26NQZ6 | -0.15 | Non-company row; no company P/E |
| USD Pending Dividends | Non-company row; no company P/E |
Raw captures
Actuals · 1BF · 2BF · Growth/P-E chart PNG · Growth/P-E chart SVG · Commodity chart PNG · Commodity chart SVG